
Leveraging Photosynthesis for Carbon Sequestration with MATLAB to win NACME’s 2025 National Virtual Bridge Engineering Design Challenge
Today’s guest blogger is Kathy Zhang, who will be sharing her conversation with the winning team from NACME’s 2025 National Virtual Bridge Engineering Design Challenge. The team was made up of incoming engineering students heading off to different US universities and they worked together to develop a prototype that can sequester carbon dioxide from the air using photosynthesis. Let’s dive into the team’s process of coming up with this innovative design!
What is the NACME 2025 National Virtual Bridge Engineering Design Challenge?
This summer, 39 students matriculating into their first year of undergraduate engineering had the unique opportunity to attend the five-week NACME National Virtual Bridge program (NVB), supported in part by MathWorks. The goal of the program is to support students’ academic and social transitions to college, including a curriculum taught by professors and graduate student teaching assistants from around the country spanning calculus, programming, physics, and engineering design. As part of the Engineering Design course taught by Dr. Taylor Lightner and Nicole Jefferson, students were challenged to work in teams and develop a product that addresses one of the 14 National Academy of Engineering grand challenges of the 21st century. In the final week of the program, each team presented their design to a panel of judges from academia and industry.
Jeremiah Cojon-Keddie, Hollis Davies, Katie Finn, Caroline Hortin, Andres Sanchez-Gonzalez, Chauncey Tillman, and Aiyrub Umatiya decided to tackle the challenge of carbon sequestration. They designed a plant window box that leverages photosynthesis to capture carbon dioxide from the atmosphere – turning every apartment window in an urban city into a micro-carbon filter. Their prototype, named the “C- filtration box”, won the program’s Engineering Design Challenge.
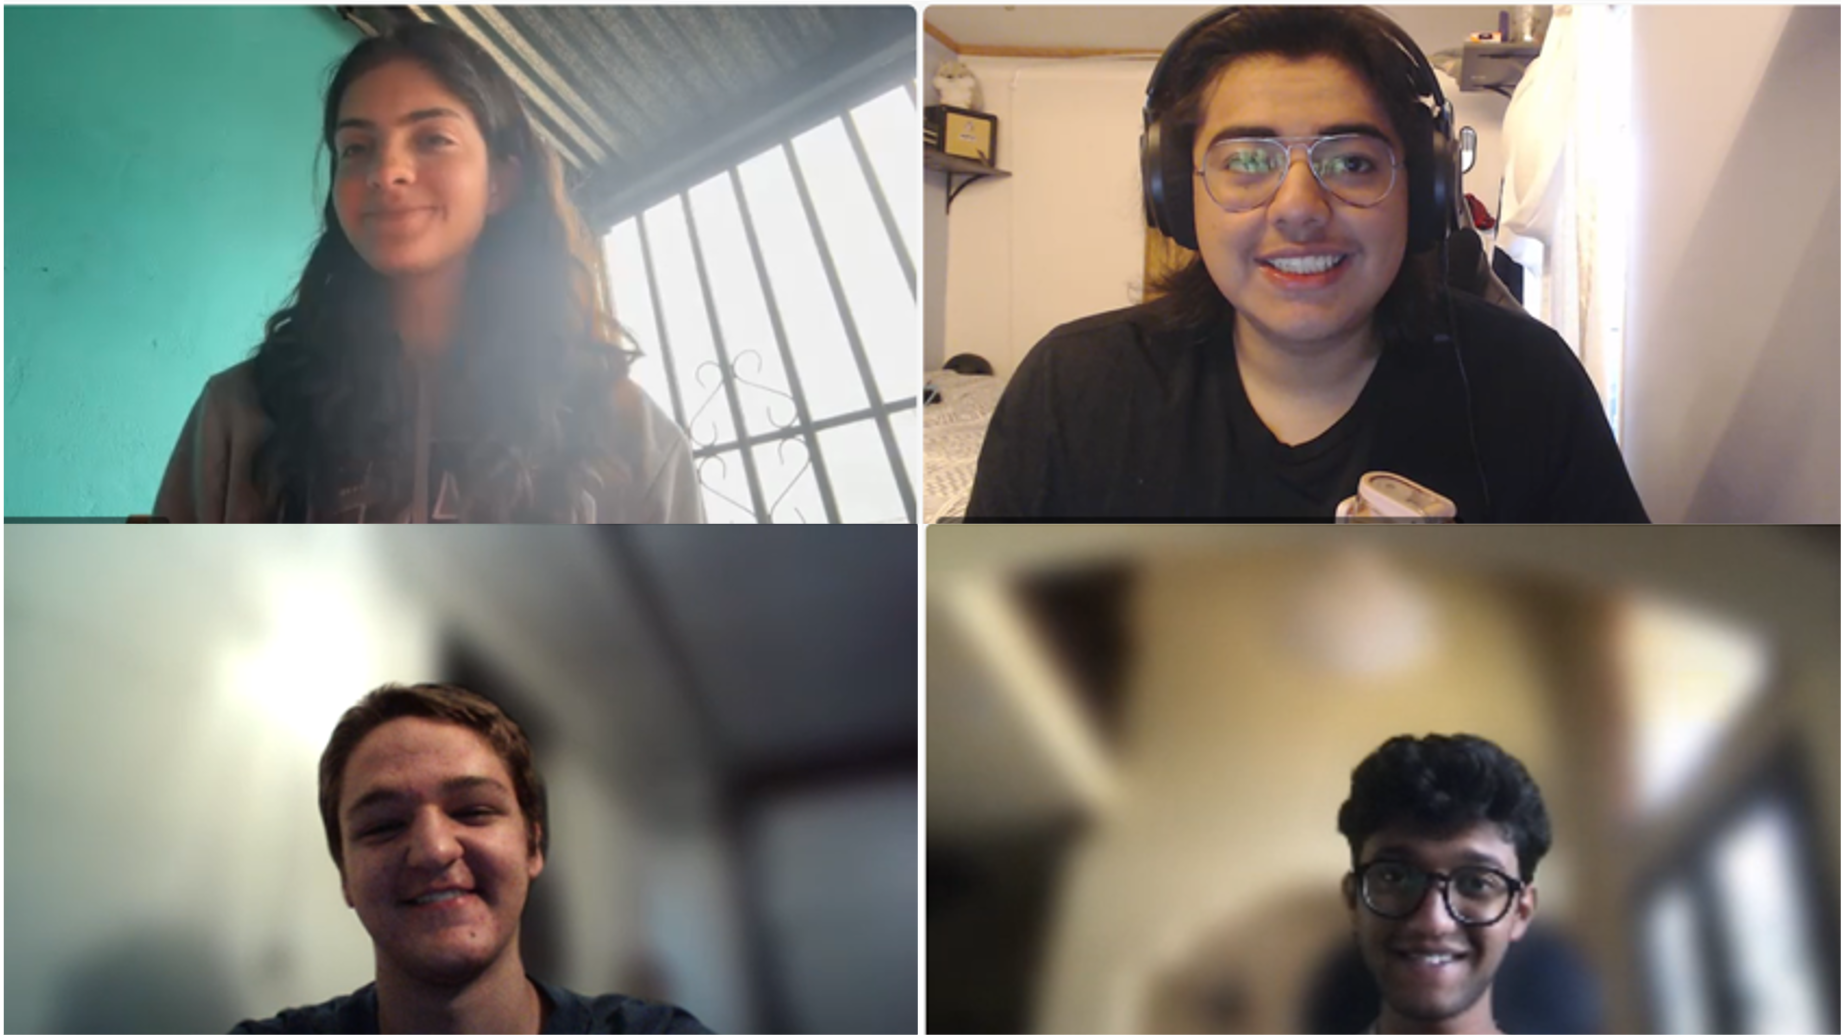
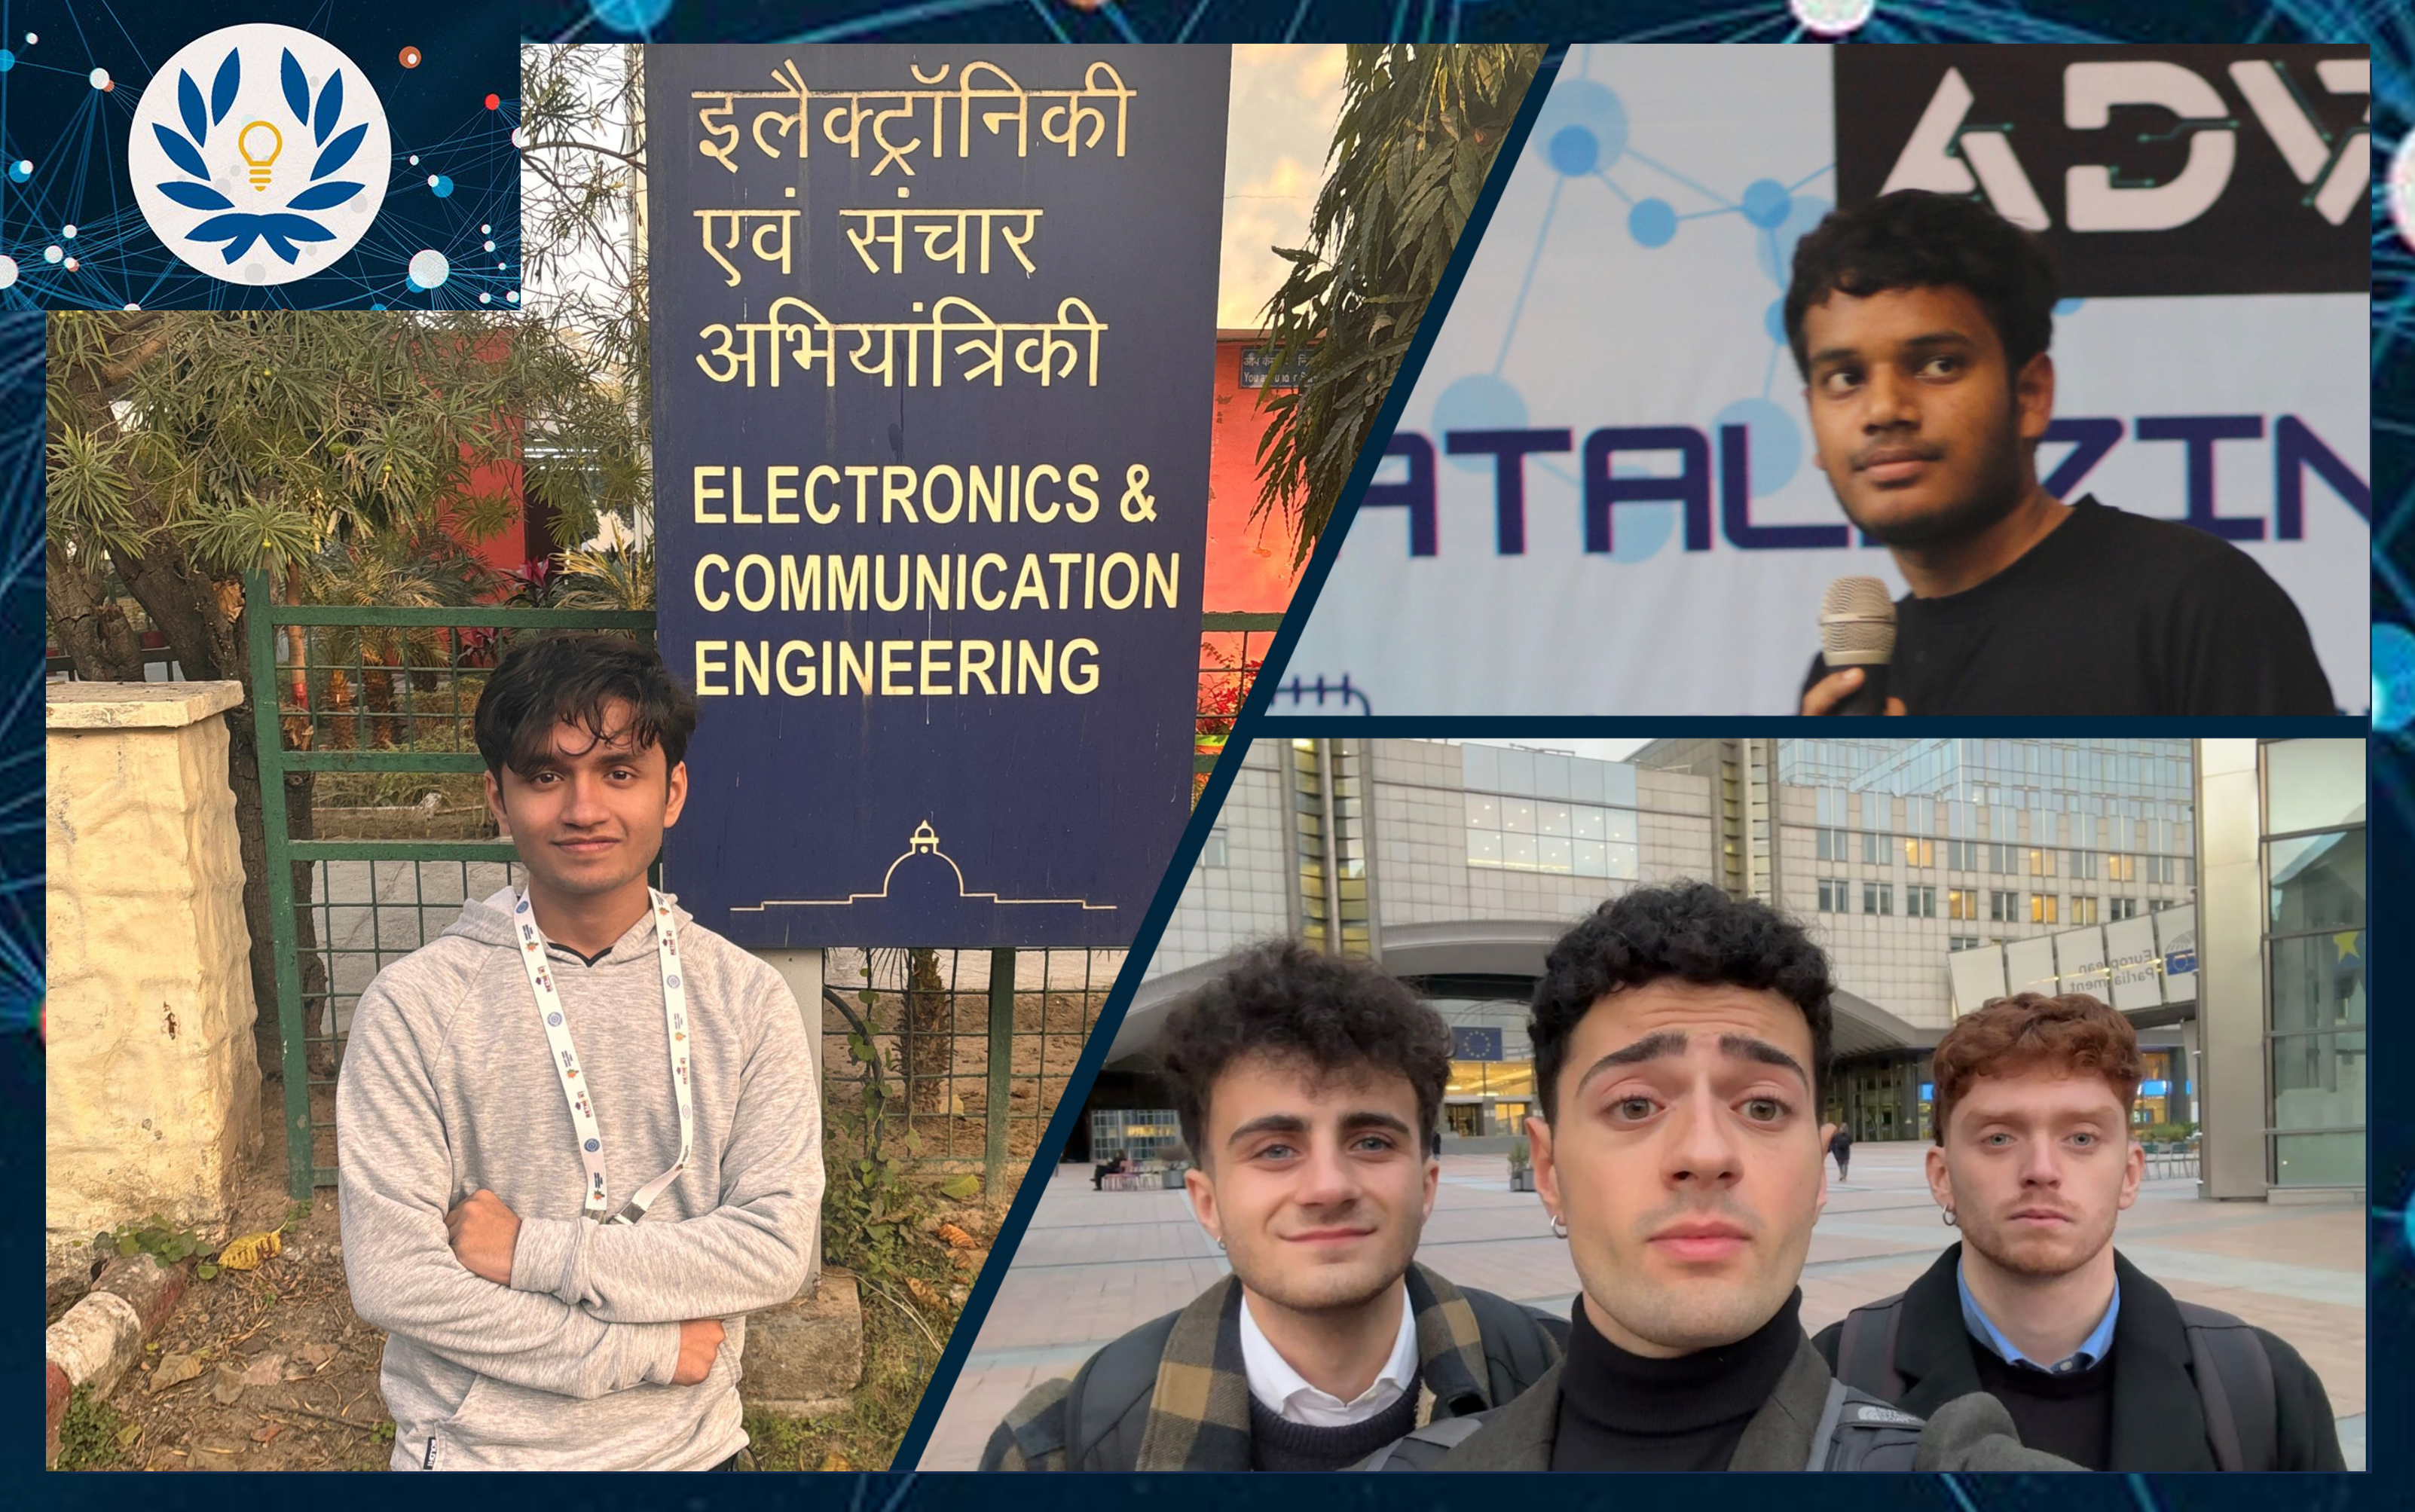
Pictured clockwise from the top left- Caroline Hortin, Andres Sanchez-Gonzalez, Aiyrub Umatiya, and Hollis Davies of the winning NACME National Virtual Bridge Engineering Design Challenge team. Not pictured are teammates Jeremiah Cojon-Keddie, Katie Finn, and Chauncey Tillman.
How does the C- filtration box work?
The C- filtration box intakes city air and filters it using plants housed inside. The design went through several rounds of iteration: while the team had first considered a prototype that simply captured CO2 from the air, they realized that transporting the captured CO2 would generate as many emissions as they had captured. When Aiyrub discovered that plant growth could be enriched by CO2, the team agreed that a biotechnological solution better served their mission. The C- filtration box contains sensors to monitor the box’s internal conditions and uses actuators, such as fans and UV light, to automatically adjust the temperature, humidity, and light penetration. The goal is to maximize photosynthesis efficiency and therefore the plants’ CO2 absorption. The sensor data is then visualized on an outer control panel screen so the user can monitor how much light is entering the box, the rate of photosynthesis, the rate of CO2 absorption, and the amount of power being consumed.
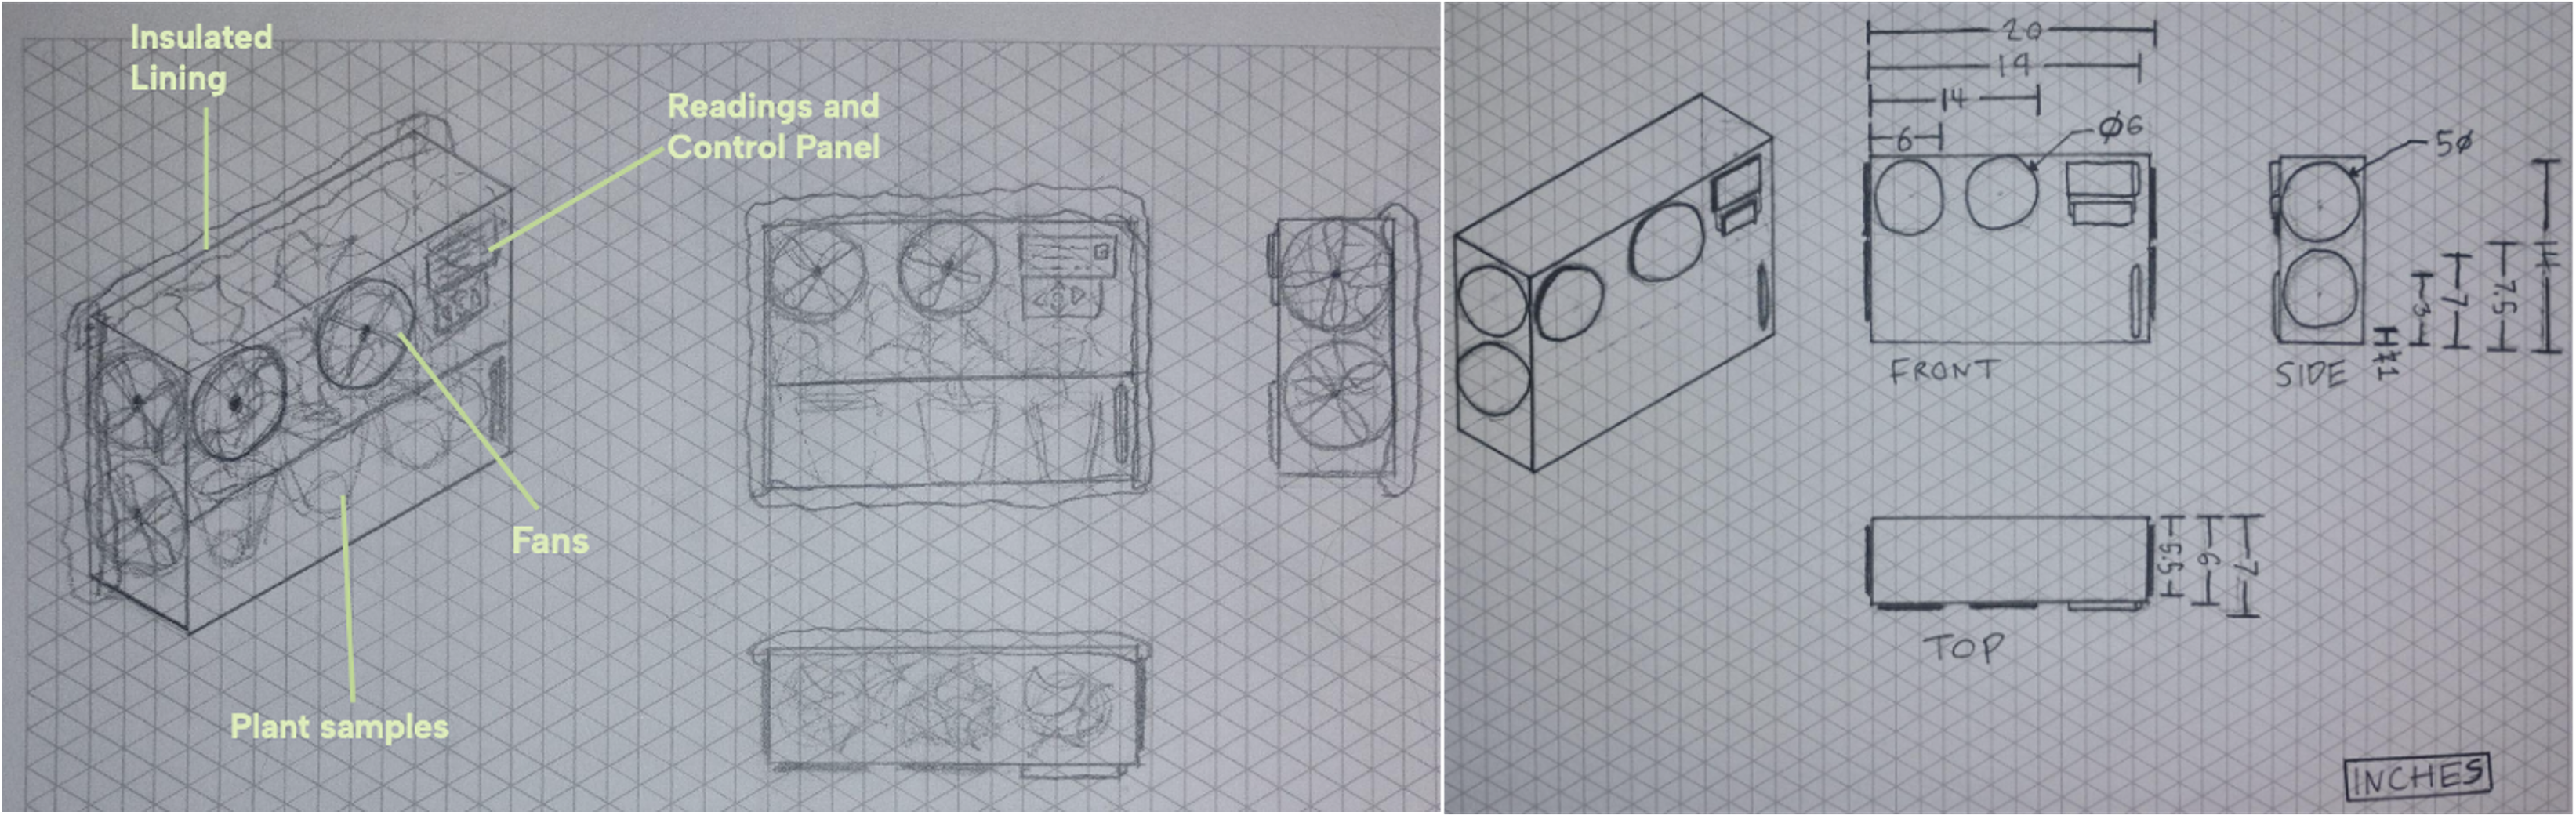
Sketches of the C- filtration box prototype. Images courtesy of Hollis Davies.
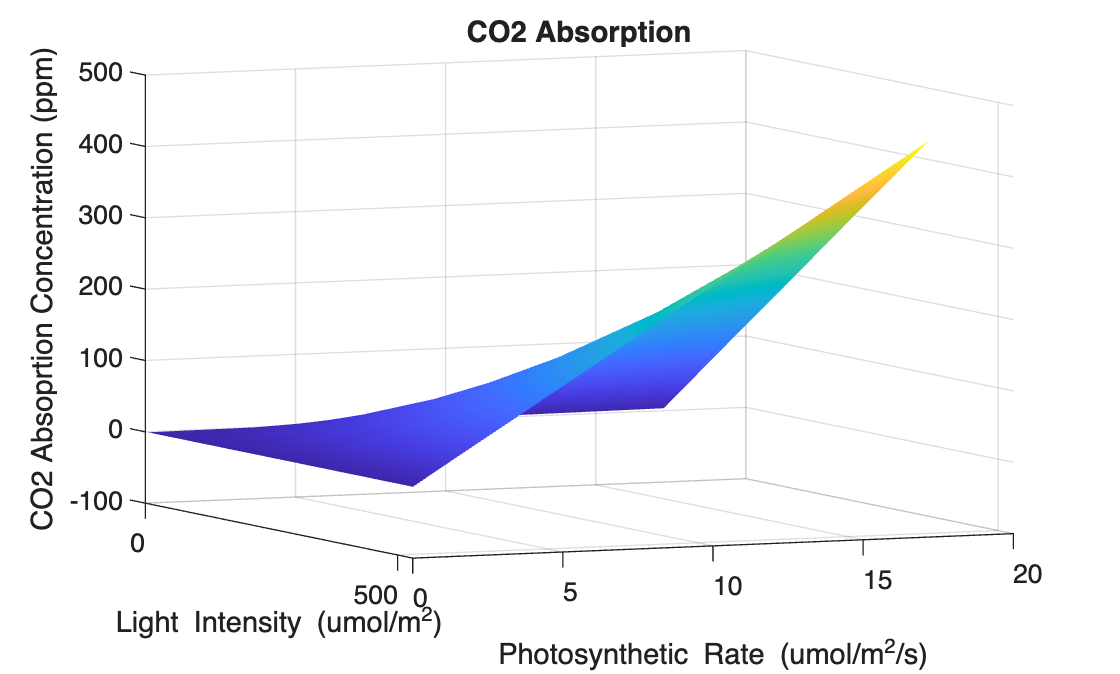
Hollis explained that they decided to use plants as the carbon filtration method after going through the process of visualizing the data in MATLAB: “Seeing a good visualization of how the plant’s CO2 absorption rate would correspond with different factors like heat or light index – a lot of it came down to looking at those graphs and seeing, OK this can work.” The clear relationship between the environmental conditions in the box and the plants’ rate of CO2 absorption gave the group confidence in their design because they realized they could essentially control the rate of CO2 absorption as easily as turning on a UV light or a fan. The MATLAB code below shows how they visualized the relationship using a 3D graph:
% Light Intensity Data – PAR in hours, values derived from a database
x = [0,0,0,5,10,50,100,186,290,390,480,520,530,510,450,420,320,300,230,120,70,30,0,0];
% Photosynthesis rate – derived from a second dataset
r = [3/20,9/200,4.5/100,2.5/200,1/180];
% Function that obtains photosynthesis rate for each light value
function e = getrate(a,t)
e = [];
for i = 1:length(a)
if a(i)>499
e(end+1) = 17+((a(i)-499)*t(5));
elseif a(i)>299
e(end+1) = 12.5+((a(i)-299)*t(4));
elseif a(i)>210
e(end+1) = 9+((a(i)-210)*t(3));
elseif a(i)>20
e(end+1) = 3+((a(i)-20)*t(2));
else
e(end+1) = (a(i)*t(1));
end
end
end
% Conform light and photosynthesis rates to a 2D plane
[x1,y1] = meshgrid(x,getrate(x,r));
% Create a trendline to approximate CO2 data from photosynthesis rate
rt = 0:0.5:19.5;
c = 0:2.5:97.5;
coef = polyfit(rt,c,5);
zFit = (polyval(coef,y1)).*((x.^2)./(x.*100));
% Create graph
surf(x1,y1,zFit);
% Add labels
xlabel(‘Light Intensity (umol/m^2)’);
ylabel(‘Photosynthetic Rate (umol/m^2/s)’);
zlabel(‘CO2 Absoprtion Concentration (ppm)’);
shading interp
title(‘CO2 Absorption’)
view([66 8])
When it came to implementing their design with code, Hollis said he started with a flowchart: “My class [in high school], it was always a template – OK, do XYZ. But I felt that it’s most helpful to start with a flowchart, just on a piece of paper. I’ll start with inputs and then I’ll get to a point where I [figure out what] I need to do [with them].” For this project, the inputs were simulated sensor data, and he needed to compute and visualize photosynthesis and CO2 absorption rates. To do this, Hollis got help online: “Some parts, I would run something and then, OK, clearly, I’m not doing something right. That’s when I would turn to outside stuff like YouTube. There’s a lot of tutorials on five dedicated MATLAB channels and they just have thousands of videos. So, it was really easy to find what we needed.”
Key Takeaways
Reflecting on their win, team members agreed while the technical aspects of their project gave them an edge, their teamwork leading up to delivering an effective presentation was the key factor contributing to the team’s win. As instructors who have participated in the program for the past three years, Dr. Lightner and Nicole shared that the competition has always been a favorite moment of theirs. Both instructors expressed that the students’ challenge presentations demonstrate how far the students come in just a few weeks not only in their technical knowledge, but also in the community they build with peers. For Dr. Lightner, she hopes that the engineering challenge helps students realize the importance of active engagement in their courses and submitting work that they are genuinely proud of.
Aiyrub’s lasting lesson from participating in the challenge embodies those goals: “At first, I was a little hesitant to share my Python code, but what I understood after doing [the project], you need to challenge yourself to learn. If I didn’t push myself to write the code, maybe we wouldn’t have won. It gave me a confidence boost that my effort wasn’t in vain, so I’m going to continue to challenge myself.”
With the program wrapped up and the fall semester about to begin, Andres said he was “very excited and quite literally counting the days” to start his degrees in Cybersecurity and Computer Engineering at the University of Cincinnati. Caroline agreed and said she felt like the bridge program was a “cliffhanger. I have this drive and this momentum I want to keep going into college.” She will be starting her first year of Chemical Engineering at the University of Kentucky, Hollis is heading to the University of Cincinnati to study Architectural Engineering, and Aiyrub is off to Texas A&M to start his degree in Aerospace Engineering. With this exciting challenge win under their belt, we are excited to see what these students will accomplish in the future!
- カテゴリ:
- MATLAB


コメント
コメントを残すには、ここ をクリックして MathWorks アカウントにサインインするか新しい MathWorks アカウントを作成します。