Adding annotations to graphs
Once you’ve analyzed and plotted your data or results, the next step is often to add the plot to a report or a paper as a document. In many cases you will need to add explanation and annotations to the data to explain its salient features to the reader of your document. The Figure Palette (one of the Plot Tools) let’s you do this by adding and configuring annotations such as arrows, text boxes, and shapes directly to the data in your plot.
To get started, plot your data and open the Figure Palette from the Figure View menu.
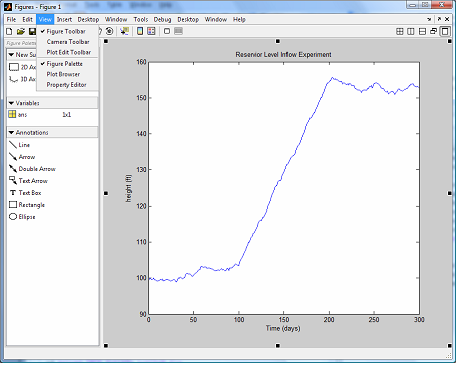
Now, suppose you want to mark the first point of inflection of the plot and add a comment explaining its meaning. Click on the Text Arrow item in the Annotations section of the Figure Palette (shown on the left), then click on the plot to position the base of the arrow and drag & release to position its head. A cursor at the base of the arrow will show you where to enter text.
Once the text is entered you can move the arrow and change its orientation by using the positioning handles at the beginning and end of the arrows.
Other arrows and shapes can convey additional information. Suppose you wanted to add a text box explaining the second inflection point and an arrow indicating the time interval between the two inflection points: this could accomplished by copying and pasting the first text arrow and adding a double arrow annotation for time interval.
By default the text box has a black border. You can remove this by double clicking it to open the Property Editor and setting its Line Style to “none”.
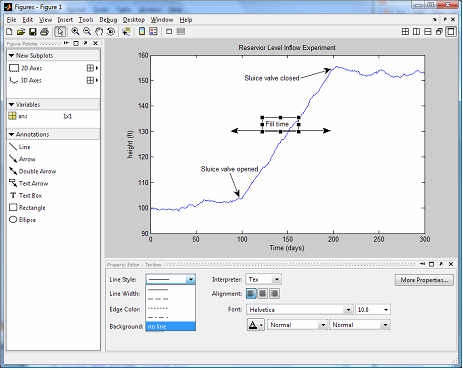
Clicking on the double arrow enables you to modify its color and size properties to get the right look.

You can also add lines to draw attention to the left and right extent of the double arrow.
Once you are finished, you can close the Plot Tools and copy the figure to your document.
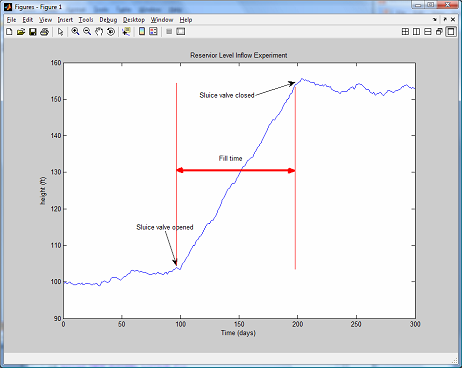
The annotations that you have added and edited have treated the figure very much as a document, combining representations of data with conceptual content (the annotations). Consequently, you may want to save your work product as it evolves. This can be done by saving it as a “.fig” file using the figure “File” menu or the MATLAB “hgsave” function. Saved figures can then be restored using the figure “File” menu or the MATLAB command “hgload”.
- カテゴリ:
- Data Tools




コメント
コメントを残すには、ここ をクリックして MathWorks アカウントにサインインするか新しい MathWorks アカウントを作成します。