The redesigned Plot Selector in R2009b
The Plot Selector has been redesigned in R2009b! The user interface takes cues from the Function Browser with a search field at the top of the tool and the ability to “tear off” the window to keep it visible. We’ve tried very hard to reuse the same concepts in the user interface when it makes sense (e.g. the search field). This makes it easier for you to apply concepts from one tool in another tool, and keeps the overall look of the product consistent.
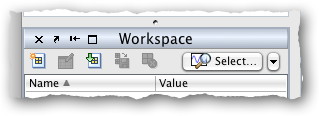
The Plot Selector is available via the  button in the Workspace Browser.
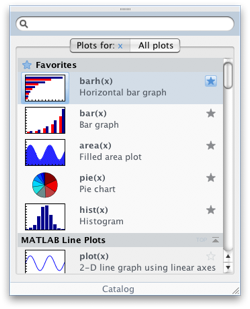
One of our overall goals with user interface design in MATLAB is to help you stay focused on what your doing. To do this, we need to offer you the right information at the right time. In the Plot Selector, this means showing you a graphic of what the plot might look like, as well as more detailed information about the what each plot does. We also show you details about a plot when you hover over it in the Plot Selector, which helps keep you “in flow”:
We also wanted to help streamline your workflow. If there are plots that you frequently use with a particular type of data, you can select the  button and promote that plot to the “Favorites” section, which appears at the top of the Plot Selector.
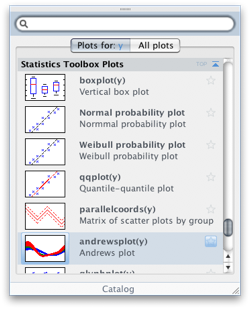
Finally, the Plot Selector now integrates with toolboxes. So if there is a plot that applies to your selected data, it will show up in the Plot Selector. For example, my Plot Selector shows plots from the Statistics Toolbox, because I have that toolbox installed:
We think this redesign will make it easier for you to plot your data and help keep you focused on the task at hand. What do you think?
- Category:
- Data Tools







Comments
To leave a comment, please click here to sign in to your MathWorks Account or create a new one.