 Cleve’s Corner: Cleve Moler on Mathematics and Computing
 The MATLAB Blog
 Guy on Simulink
 MATLAB Community
 Artificial Intelligence
 Developer Zone
 Stuart’s MATLAB Videos
 Behind the Headlines
 File Exchange Pick of the Week
 Hans on IoT
 Student Lounge
 MATLAB ユーザーコミュニティー
 Startups, Accelerators, & Entrepreneurs
 Autonomous Systems
 Quantitative Finance
 MATLAB Graphics and App Building
Crepuscular Calculations
Happy Crepusculus! Never heard of Crepusculus? I’ll come back to that later. Instead, let me begin with a fun fact: the shortest day of the year is December 21st.

What? You already knew that fun fact? Okay smarty-pants, here’s a trick follow-up question: when is the earliest sunset? It turns out it comes well before the shortest day.
Sounds crazy doesn’t it? But I’ll prove it to you, courtesy of a lovely File Exchange submission called SUNRISE by François Beauducel. As François says, it “computes sunrise and sunset times from any geographical location on Earth.” He works at the Institut de Physique du Globe de Paris, so I’m pretty sure he knows what he’s doing here.
Watch this. Here I am in Natick, Massachusetts.
lat = 42.3;
lon = -71.3;
alt = 0;
tzone = -5;
I’m going to use our lovely DATETIME to create a year’s worth of dates. I’m going to start my calendar in July because I want December to be in the middle.
d = datetime(2019,7,1:365);
See what I did there? I created a vector of dates from July 1, 2019 to July 365, 2019! DATETIME handles the part that says “Silly! There is no July 200, 2019, so I’ll convert it to January 16, 2020 for you.” It’s a very convenient way to make date vectors.
The SUNRISE function expects an old-school DATENUM, but that’s easily managed.
[srise,sset] = sunrise(lat,lon,alt,tzone,datenum(d));
Merci François! Now we just calculate the hour and plot. Voilà!
sriseHour = 24*(srise - floor(srise));
ssetHour  = 24*(sset  - floor(sset));
plot(d, sriseHour, d, ssetHour, 'LineWidth', 3)
set(gca, ...
    'YLim',[0 24], ...
    'YTick',[0 6 12 18 24], ...
    'YTickLabel',{'Midnight','6:00 AM','Noon','6:00 PM','Midnight'})
title('Sunrise and Sunset')
xlabel('Date')
ylabel('Time of Day')
legend({'Sunrise','Sunset'},'Location','best')
set(gca,'YDir','reverse')
grid on
box on

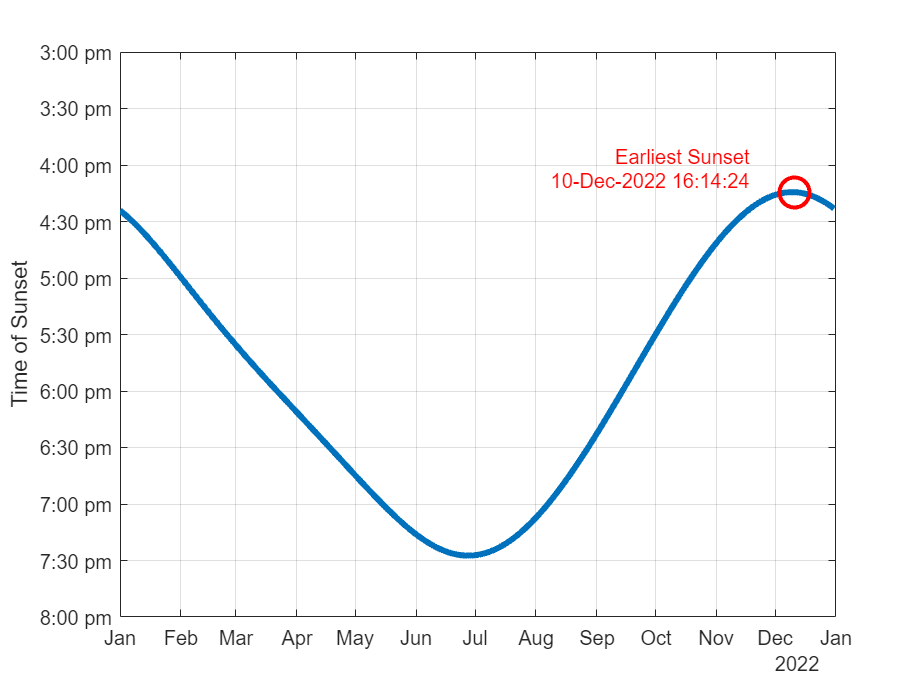
You can see the two curves are somewhat offset. The earliest sunset advances, but the latest sunrise retreats, leaving the shortest day safely in place between them.
Where I live, the earliest sunset is on December 10th this year, fully eleven days before the solstice.
[~,ix] = min(ssetHour);
d.Format = 'dd MMM yyyy HH:mm:ss';
earliestSunset = datetime(sset(ix),'ConvertFrom','datenum');
legend('off')
line(d(ix),ssetHour(ix), ...
    'Marker','o','Color',[0.85 0.325 0.098], ...
    'LineWidth',3,'MarkerSize',18)
xlim([datetime(2019,7,1) datetime(2020,7,1)])
ylim([12.0 24.0])
text(d(ix),ssetHour(ix), ...
    sprintf('Crepusculus!\n%s\n\n\n\n',string(earliestSunset)), ...
    'HorizontalAlignment','center')

I like to call this date Crepusculus in honor of the word “crepuscular”, which means “of or relating to twilight”. I give it a fancy name because 1. it sounds cool and 2. it’s worth celebrating! After this date, the sun will set later every day until June. That’s almost as good as the solstice itself, especially for those of us that don’t often see the sun rise. And since it happens before the solstice, it gives me a sorely needed head start on solstitial merriment.
But it’s not the same for everybody! The earliest sunset changes by latitude. How much? Let’s look! We’ll loop across a whole bunch of latitudes and make a plot.
latitudeList = 1:0.2:65;
earliestSunset = NaT(size(latitudeList));
The NaT function (NaT stands for “Not a Time”) is a nice shorthand for allocating a vector of DATETIMEs. It functions like ONES or ZEROS, only for dates.
for i = 1:length(latitudeList)
    lat = latitudeList(i);

    [srise,sset] = sunrise(lat,lon,alt,tzone,datenum(d));
    ssetHour = 24*(sset - floor(sset));

    [~,ix] = min(ssetHour);
    earliestSunset(i) = d(ix);
end
plot(latitudeList,earliestSunset,'.')
grid
xlabel('Latitude (deg)')
ylabel('Date of the Earliest Sunset')

Use the DIFF function to find the leading edge of each step change.
xlim([25 50])
ix = find(diff(datenum(earliestSunset)))+1;
hold on
plot(latitudeList(ix),earliestSunset(ix),'ro')
hold off

Since tables are nice, let’s make a TABLE of the mapping from latitude to date.
latTable = table(latitudeList(ix)',earliestSunset(ix)', ...
    'VariableNames',{'Latitude','EarliestSunset'})
latTable=45×2 table
    Latitude    EarliestSunset
    ________    ______________

       1.6       05-Nov-2019
       2.2       06-Nov-2019
       2.8       07-Nov-2019
       3.4       08-Nov-2019
       4.2       09-Nov-2019
       4.8       10-Nov-2019
       5.6       11-Nov-2019
       6.2       12-Nov-2019
         7       13-Nov-2019
       7.8       14-Nov-2019
       8.6       15-Nov-2019
       9.4       16-Nov-2019
      10.2       17-Nov-2019
      11.2       18-Nov-2019
        12       19-Nov-2019
        13       20-Nov-2019
      ⋮
Now for the big finish. Let’s use GEOPLOT to paint the crepuscular minima across the lower 48 states of the US.
ixLow = find(latTable.Latitude > 25,1);
ixHigh = find(latTable.Latitude > 48,1);
lons = -130:5:-60;
for ix = ixLow:ixHigh

    lat = latTable.Latitude(ix);
    dat = latTable.EarliestSunset(ix);
    geoplot(lat*ones(size(lons)),lons,'Color','red');
    hold on
    dat.Format = 'MMM d';
    text(lat,max(lons)," " + string(dat),'FontSize',9)

end
hold off
geolimits([25 50],[-130 -60])

And now let’s do the same for Europe.
ixLow = find(latTable.Latitude > 35,1);
ixHigh = find(latTable.Latitude > 60,1);
lons = -20:5:40;
for ix = ixLow:ixHigh

    lat = latTable.Latitude(ix);
    dat = latTable.EarliestSunset(ix);
    geoplot(lat*ones(size(lons)),lons,'Color','red');
    hold on
    dat.Format = 'MMM d';
    text(lat,max(lons)," " + string(dat),'FontSize',9)

end
hold off
geolimits([30 65],[0 30])

If you live in the regions contained by these maps, you now know when to celebrate Crepusculus. If not, take my code and do some quick crepuscular calculations.
However you celebrate the solstice, I hope you have a good one!
- カテゴリ:
- File Exchange


コメント
コメントを残すには、ここ をクリックして MathWorks アカウントにサインインするか新しい MathWorks アカウントを作成します。