
What Does a Spacecraft Instrument Really See?
Mike’s pick this week is spacecraft-vector-intersection by George Xystouris nominated by Kostas Leptokaropoulos
What does an instrument actually see during flight? For fixed cameras this may be straightforward, but for rotating particle instruments, or for any case where a generalized vector such as sunlight or plasma flow matters, the answer can depend strongly on the geometry of the spacecraft itself. Dr George Xystouris created a MATLAB-based tool to answer this deceptively simple spacecraft-science question.
The tool uses a 3D model of the spacecraft to calculate the field of view of an instrument and identify when parts of the spacecraft obstruct that view. This is scientifically important because unrecognized obstructions can affect the interpretation of directional measurements, including particle fluxes and angular distributions.
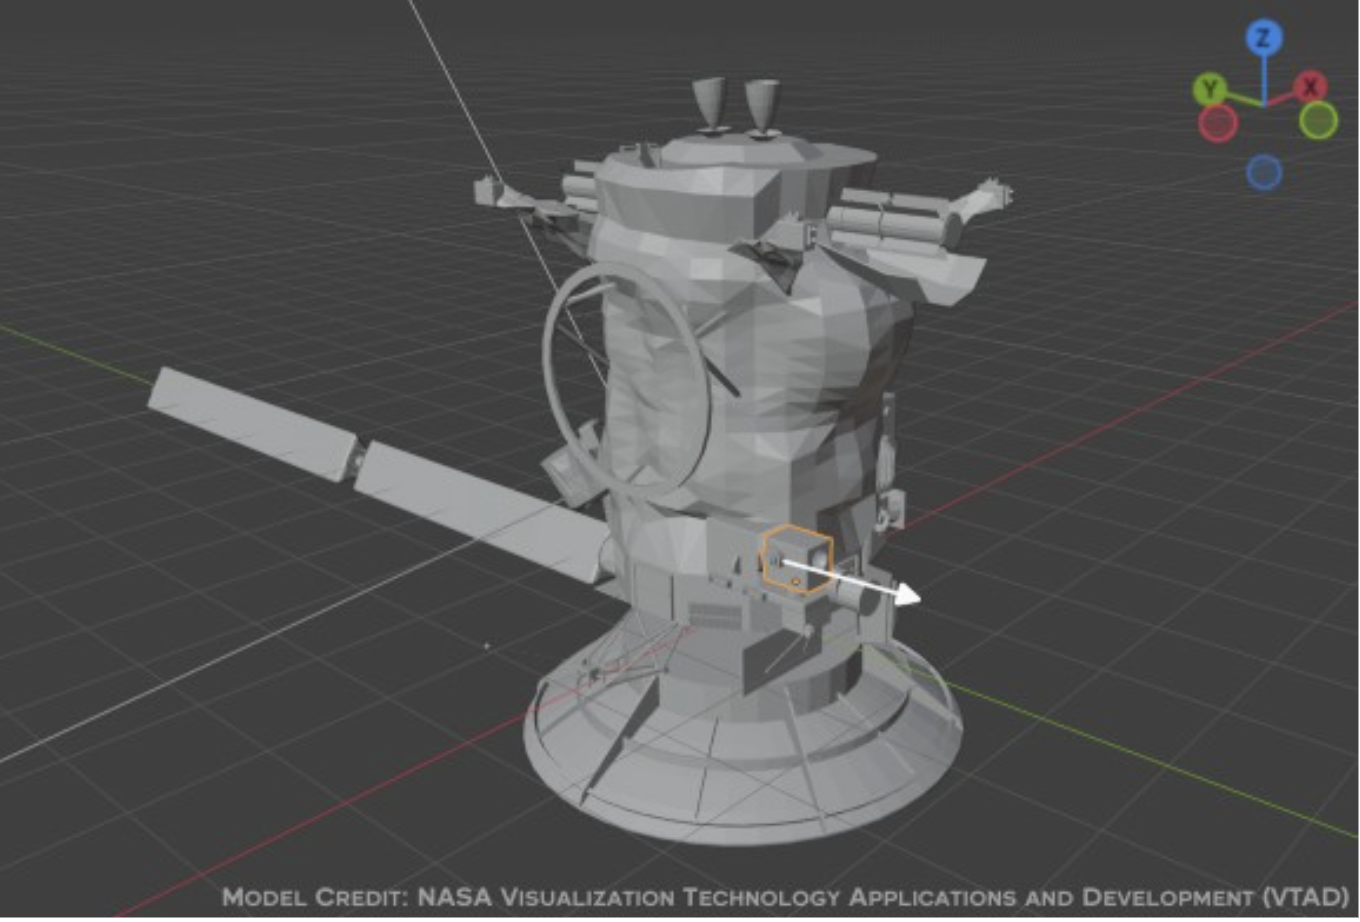
Figure 1. Cassini 3D model with the CAPS instrument outlined; model credit: NASA Visualization Technology Applications and Development.
Cassini CAPS as an example
In the example prepared by George, the method is applied to the Cassini spacecraft, using a NASA 3D model and focusing on the Cassini Plasma Spectrometer (CAPS). CAPS measured in-situ charged-particle flux, kinetic energy, and travel direction at the spacecraft location. Because CAPS rotated between -80° and +104° in the spacecraft XY plane, not every detector necessarily had a clear view of space at every scan angle. For the ion mass spectrometer, the geometry question becomes especially practical: the detector contains eight vertically stacked elements, and nearby instruments or spacecraft structures can intermittently block the top or bottom detectors at the extremes of the scan. The same workflow can also show how the instrument view changes when the spacecraft configuration changes. In Cassini’s case, the release of the Huygens probe opened the field of view of the bottom two detectors.
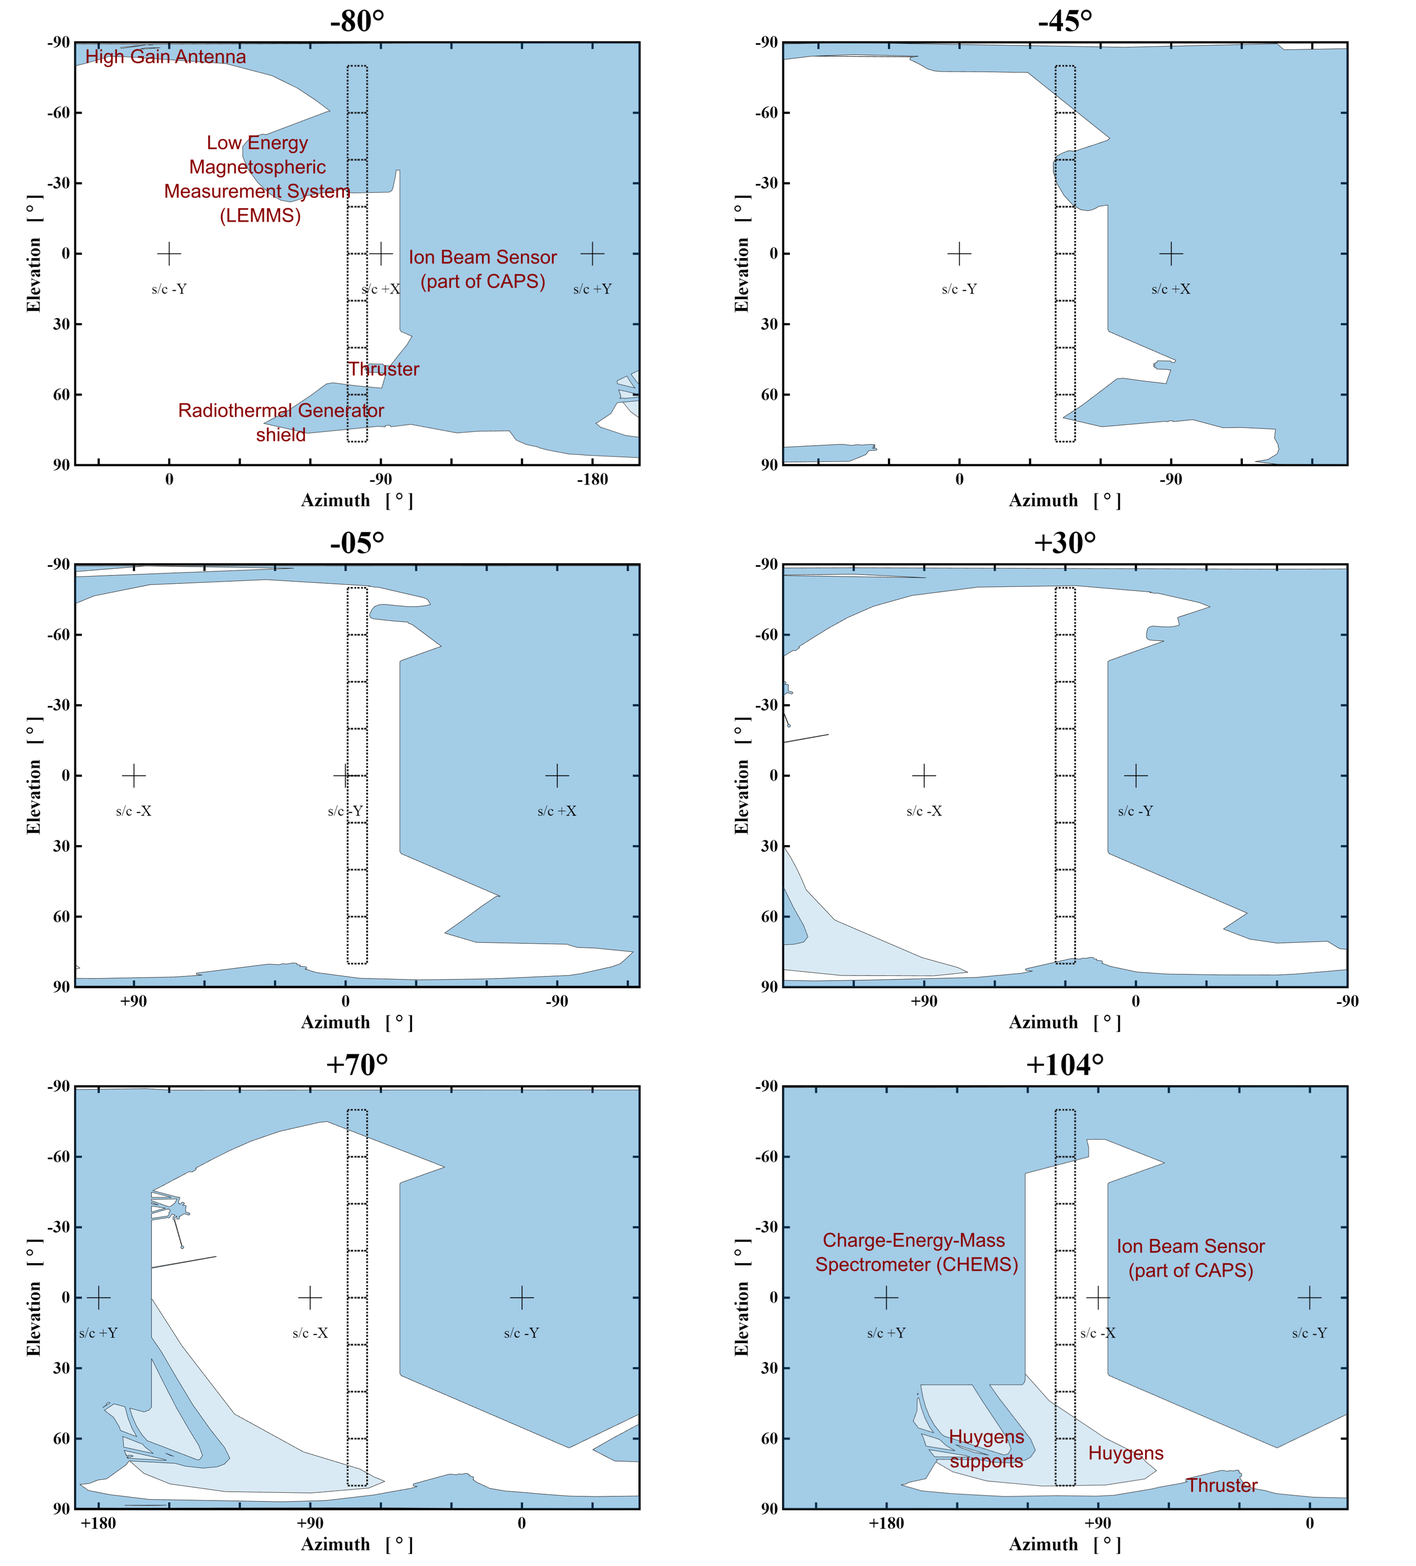
Figure 2. Example visibility map illustrating how spacecraft geometry influences the instrument field of view.
Why MATLAB?
A key challenge in this problem is working reliably with complex spacecraft 3D geometry. MATLAB provided the core environment for importing, visualizing, and processing the model, and for converting the visibility calculations into clear 2D maps. Community-developed tools added support for a wider range of 3D object formats, making the workflow more flexible for different spacecraft models.
What makes this useful beyond Cassini?
The same method can be applied to other spacecraft, provided that a suitable 3D model is available. That makes it useful in two complementary ways: during mission design, it can help assess candidate instrument placements and possible obstructions; for legacy missions, it can support reanalysis of data where spacecraft geometry may influence the scientific interpretation.




评论
要发表评论,请点击 此处 登录到您的 MathWorks 帐户或创建一个新帐户。