Guest Writer: Eric Ludlam Eric Ludlam is the development manager of MATLAB’s Charting team. Eric has a whopping 27 years of experience working in MATLAB Graphics, starting in MATLAB... read more >>

Guest Writer: Eric Ludlam Eric Ludlam is the development manager of MATLAB’s Charting team. Eric has a whopping 27 years of experience working in MATLAB Graphics, starting in MATLAB... read more >>
Guest Writer: Leia Rich Leia is a software engineer on the MATLAB Charting Team. She first joined MathWorks as part of the Engineering Development Group (EDG) in 2022, and later... read more >>

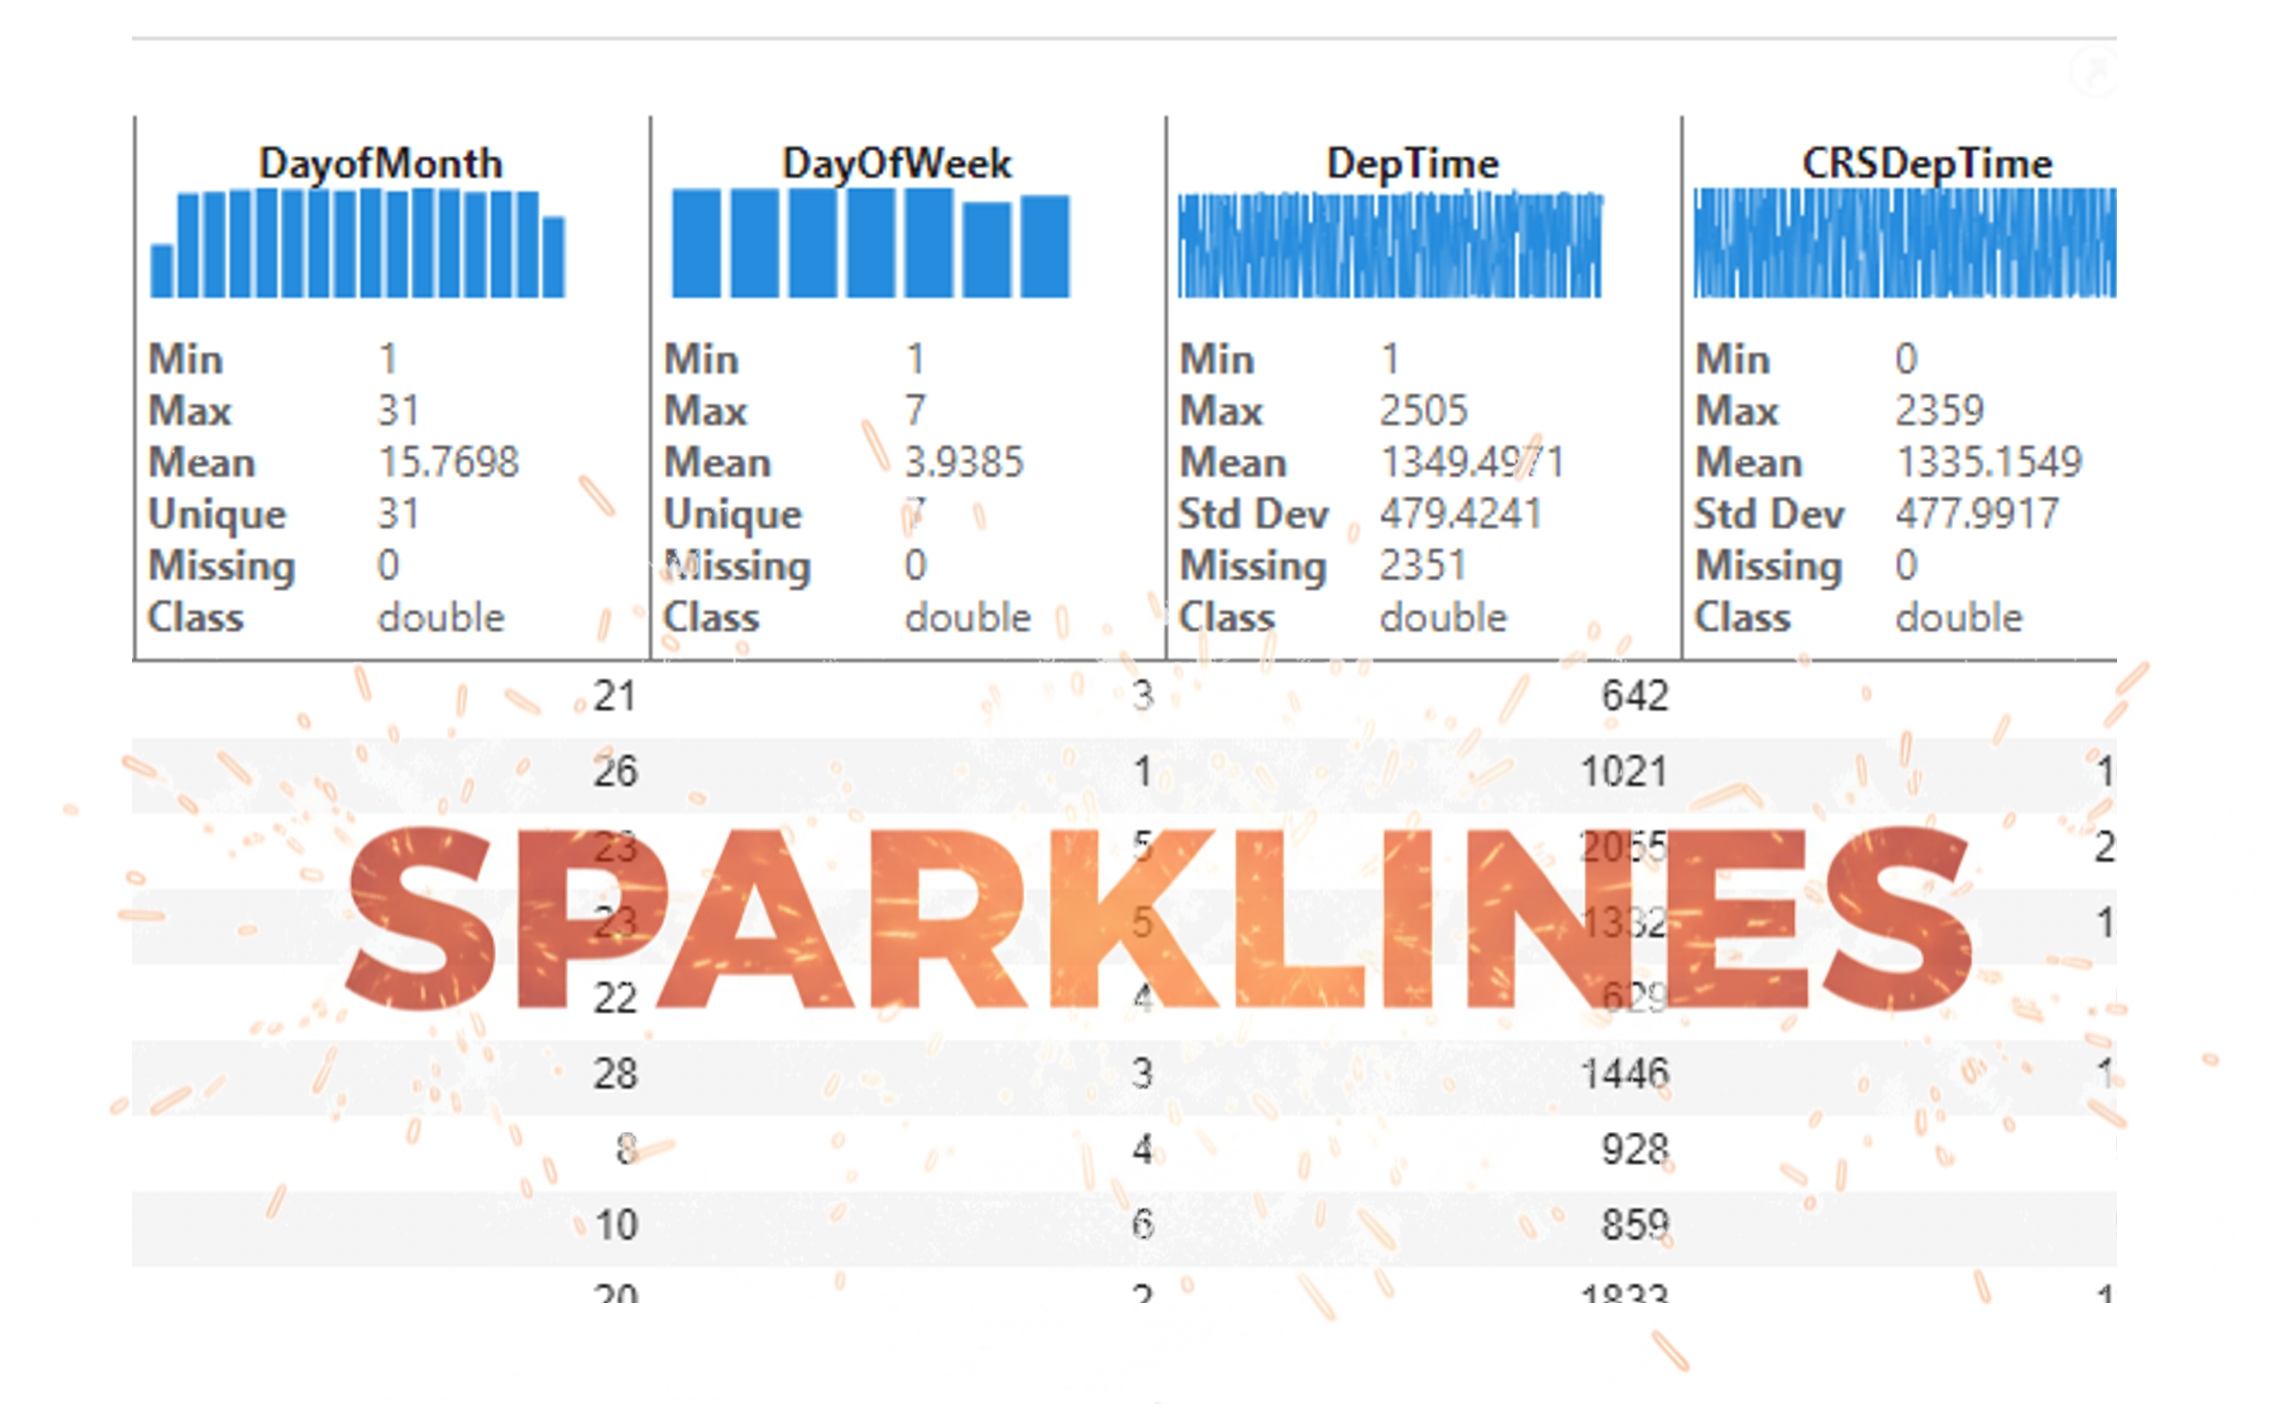
Did you know you can explore visualizations and basic statistics of tabular data directly within a live script without writing a single line of code? You can also change data types, sort, and filter... read more >>

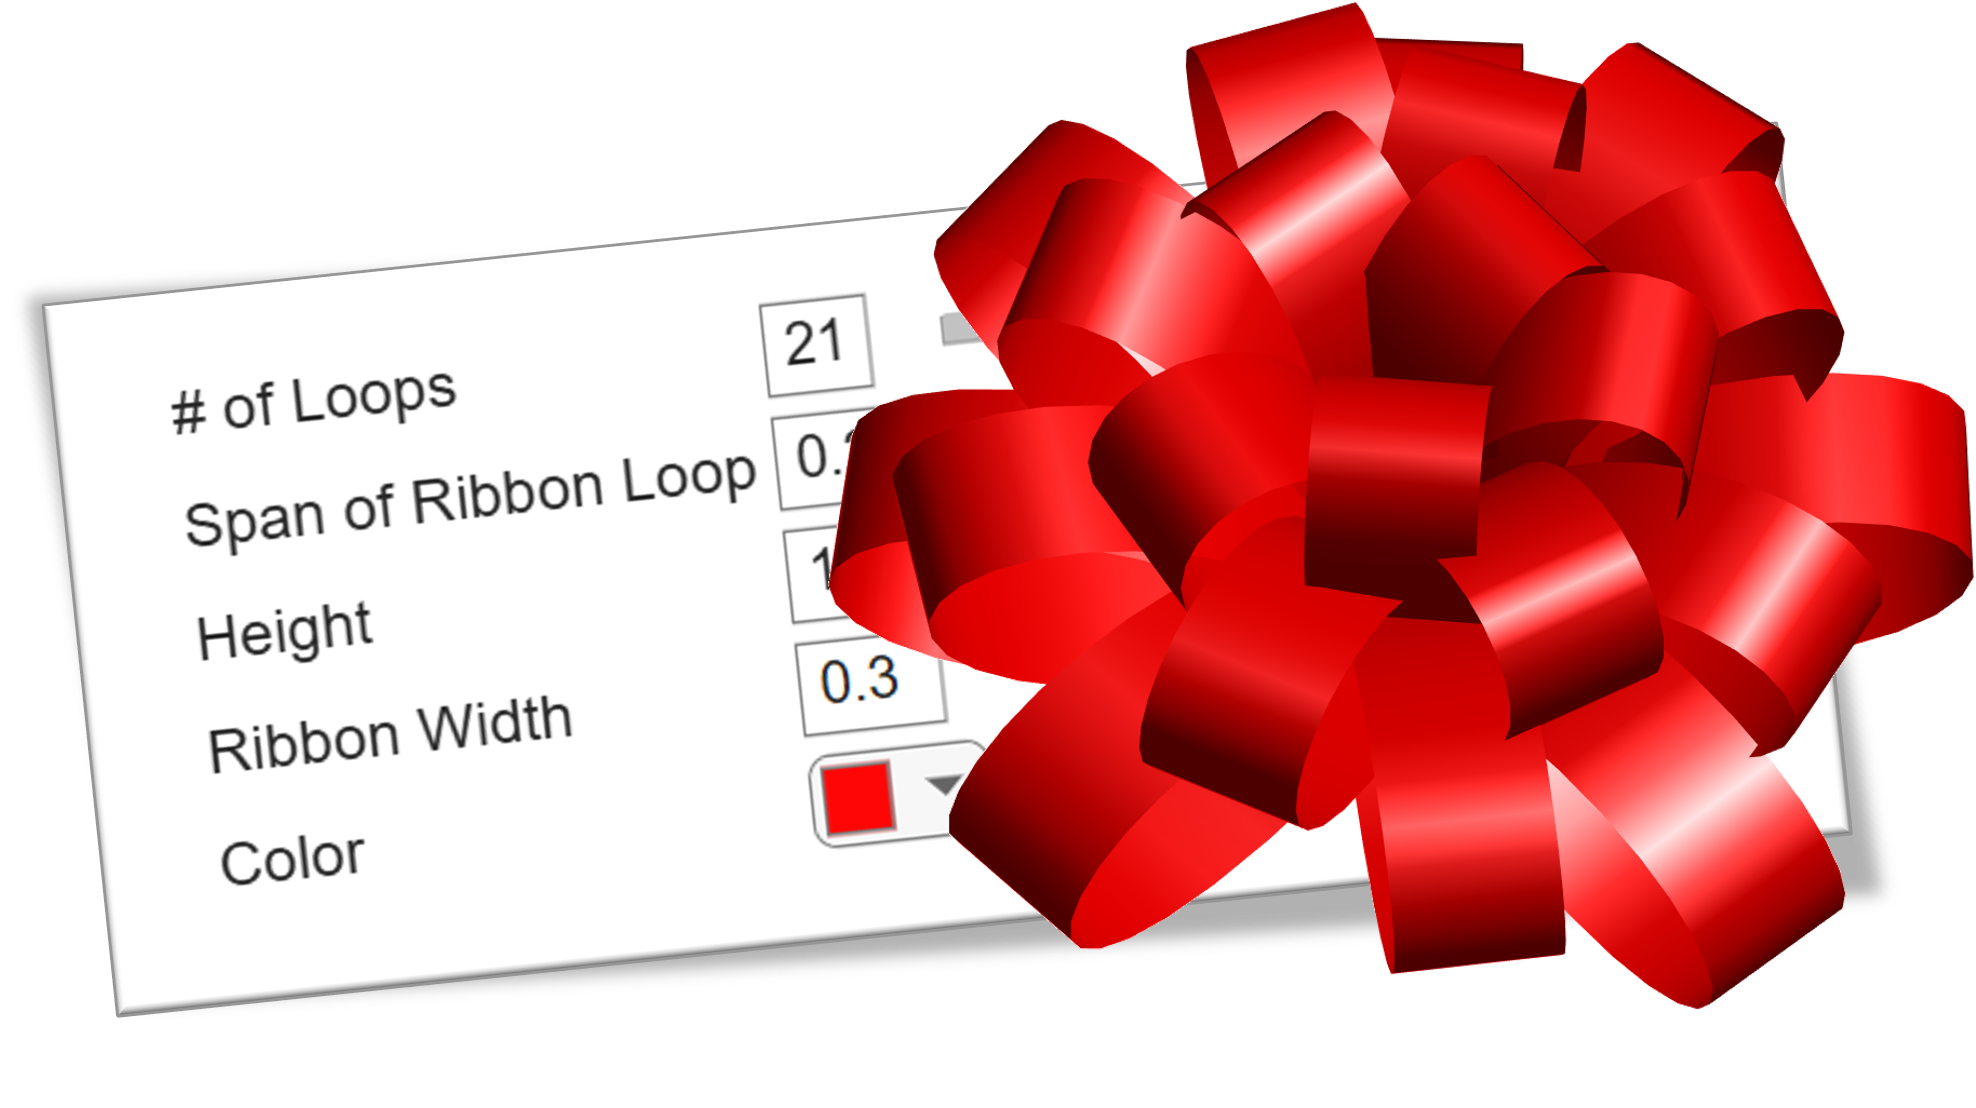
Guest Writer: Maddie Moon
Maddie first worked with the Graphics and App Building team during her Engineering Development Group (EDG) internship in 2023. After graduating college, she... read more >>

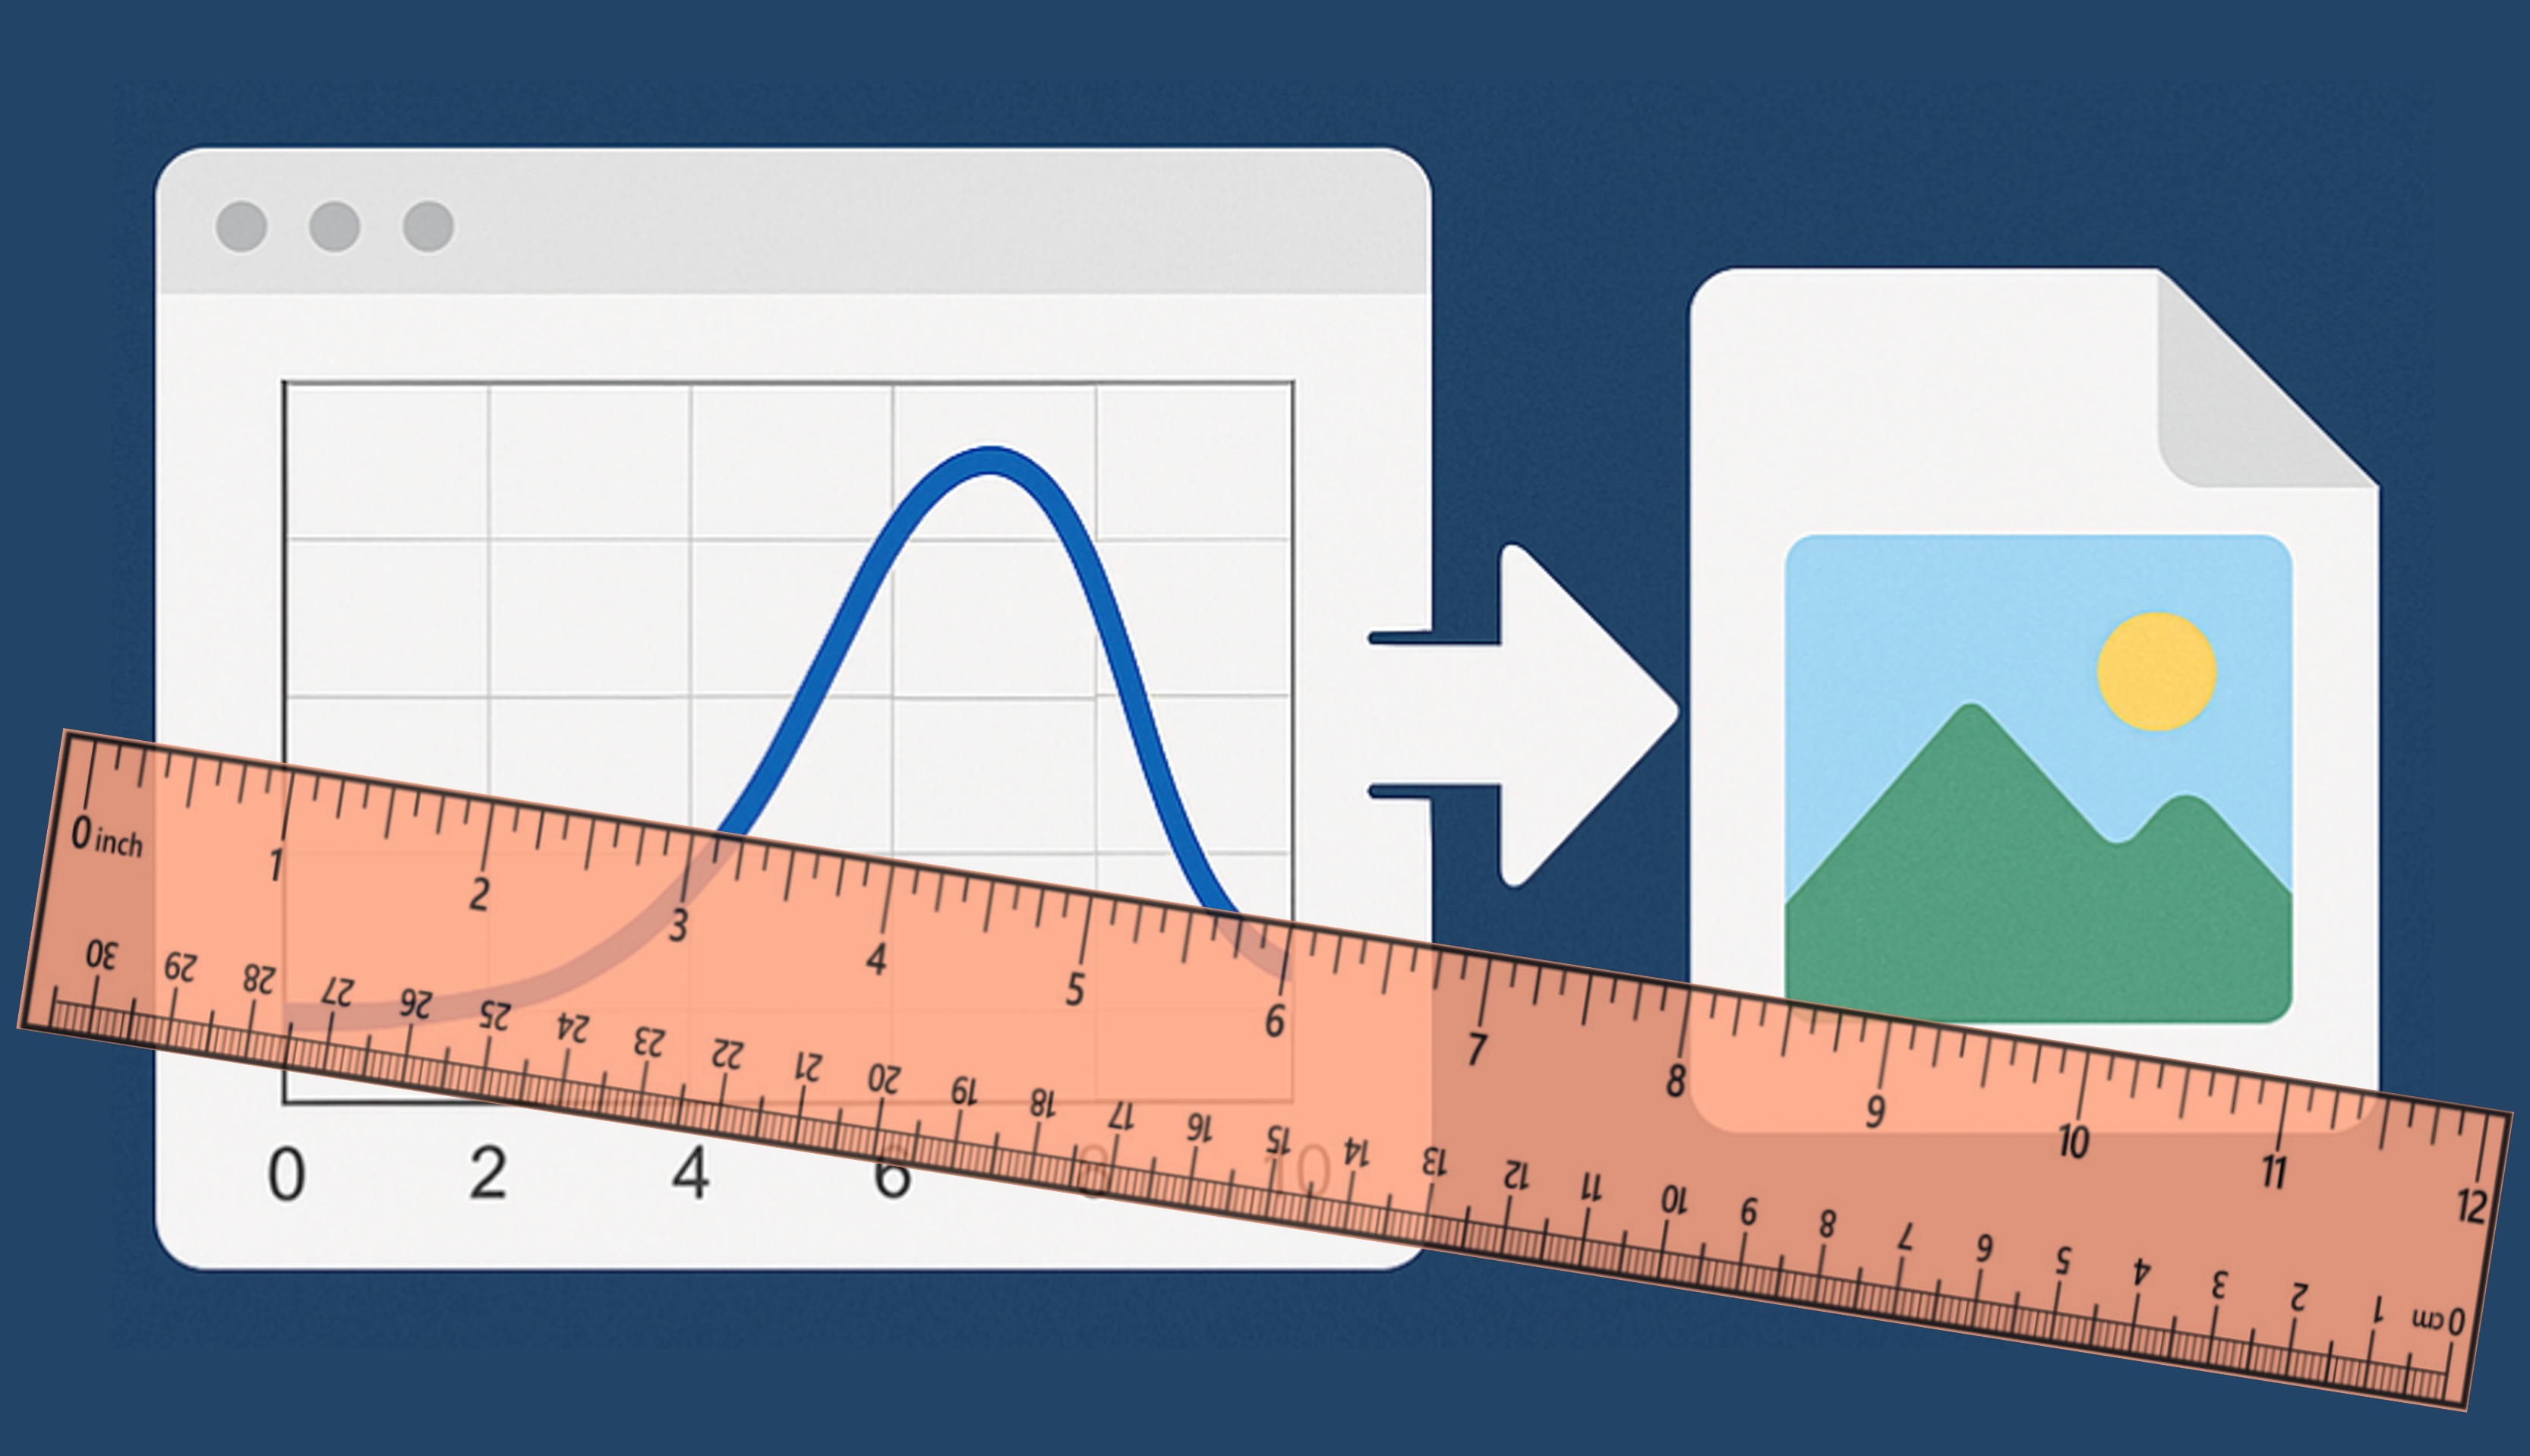
Guest Writer: Grant Marshall
Grant is a software engineer on the MATLAB Graphics & Charting Team. He first joined MathWorks in 2023 as a member of the Engineering Development Group (EDG) and... read more >>
Guest Writer: Sonia Sethi
Sonia is a product marketer with the MATLAB Outbound Team, focused on developing technical content and uncovering data-driven insights. She enjoys turning complex ideas… read more >>

Guest Writer: Jasmine PoppickJasmine works in documentation at MathWorks, both as a writer for the App Building area and as a Senior Team Lead for the Math area. Her first introduction to MATLAB... read more >>
Are you ready to take your app building skills to the next level? This article walks through an advanced workflow for assembling a flight tracking dashboard. While the techniques covered are... read more >>

The long-awaited dark theme is now available in MATLAB R2025a. This article serves as a guide for designing charts and apps in a specific theme or that adapt automatically to either theme. By... read more >>
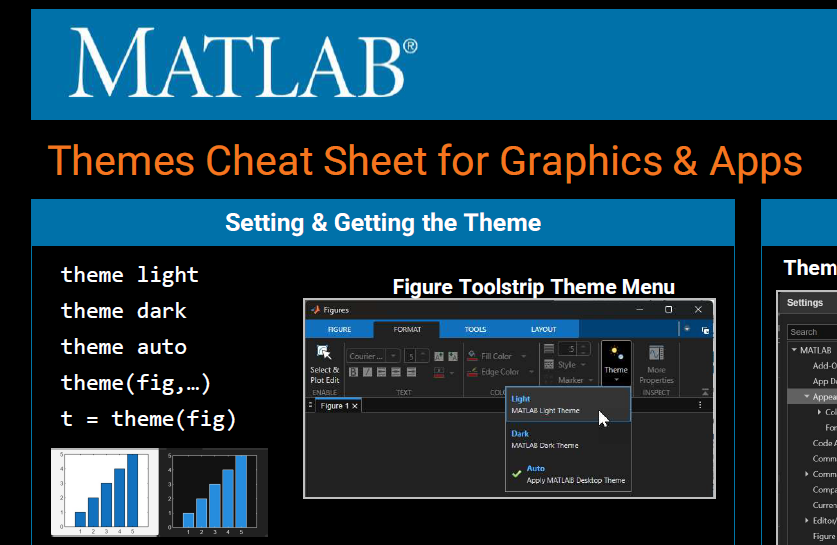
Guest Writer: Abby Skofield
We're excited to welcome Abby Skofield back to the blog! Abby has been at the forefront of bringing dark mode to MATLAB graphics and apps, and today she’s sharing... read more >>
These postings are the author's and don't necessarily represent the opinions of MathWorks.