
Vacation Fitness Analytics: Unveiling Insights with MATLAB
 |
Guest Writer: Afiq Azaibi
I’m happy to introduce Afiq Azaibi, a developer on the Charting Team at MathWorks and avid traveler. Afiq’s first contributions to the team have become popular tools for MATLAB users, xline and yline, which create ConstantLine objects (R2018b). Today Afiq will introduce two similar features he created for R2023a, xregion and yregion, which create ConstantRegion objects. Afiq has also given us the opportunity to explore his travel data, which has served as inspiration for many of us to venture outside and discover new places.
|
Break free from the everyday grind and indulge in some travel (analysis). I've been fortunate to have the opportunity to go on several spurts of travel and collect some data along the way. Join me in exploring some insights of my modest datasets.
websave('travelAndMileageTables.mat','https://blogs.mathworks.com/graphics-and-apps/files/travelAndMileageTables.mat'); % download file to current directory
load travelAndMileageTables.mat
head(tripTbl)

head(mileageTbl)

These two tables are populated from 2 different parts of my life over the past 3 years. The first table denotes all trips that I've taken and the second table is a modified version of my travel distance on foot logged by my phone.
The question I'm interested in is whether there are any patterns to my foot travel over the past 3 years. Let's take a look at the daily mileage.
clf;
ax = axes;
dailyMileageLine = plot(ax, mileageTbl.Date, mileageTbl.Mileage, 'k', 'DisplayName', 'Daily Mileage');
l = legend(ax);
ax.YLabel.String = 'Distance of Foot Travel (Miles)';
fig = ancestor(ax,'figure');
fig.Position(3) = 1400;

There are some high mileage times scattered throughout the years. The simplest explanation might be to chock it up to seasonal exercising. We can label seasons by using xregion which produces a ConstantRegion. A ConstantRegion object is bounded along one axis and unbounded along the opposite. In the case of xregion, it is bounded along the x-axis and unbounded along the y-axis.
numSeasons = 13;
startDateSeason = datetime(2020, 12, 1);
seasonDuration = calmonths(3);
for i = 1:numSeasons
currRegion = xregion(startDateSeason, startDateSeason + seasonDuration);
switch mod(i,4)
case 1
set(currRegion, 'FaceColor', 'b', 'DisplayName', 'Winter');
winterRegion = currRegion;
case 2
set(currRegion, 'FaceColor', 'g', 'DisplayName', 'Spring');
springRegion = currRegion;
case 3
set(currRegion, 'FaceColor', 'y', 'DisplayName', 'Summer');
summerRegion = currRegion;
case 0
set(currRegion, 'FaceColor', 'r', 'DisplayName', 'Autumn');
autumnRegion = currRegion;
end
startDateSeason = startDateSeason + seasonDuration;
end
legend([dailyMileageLine, winterRegion, springRegion, summerRegion, autumnRegion]);
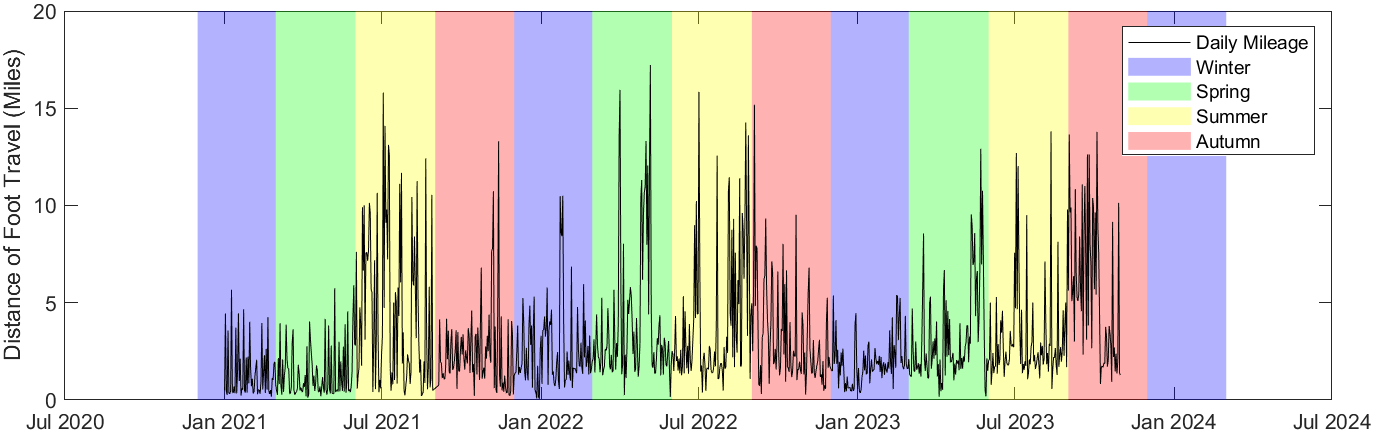
Comparing all the regions of similar color, it doesn't appear that there's much overlap between activity and the season. Let's remove the seasons and instead highlight when I was traveling. Both xregion and yregion can take in a vector of start and end points so the syntax below will leverage that.
seasonRegions = findobj(ax, 'Type', 'ConstantRegion');
delete(seasonRegions);
travelRegions = xregion(ax, tripTbl.startDate, tripTbl.endDate, 'DisplayName', 'Time away from home')

legend([dailyMileageLine travelRegions(1)]);

The relationship between high mileage days and periods of travel looks a little clearer. The spikes in daily mileage are mostly clustered in the shaded regions but there is still variability within some travel periods. Since the table has the data, let's break down the trips based on whether or not I was on vacation. We can leverage the SeriesIndex property to depict the two different types of trips as a different series, each sharing a different color.
delete(travelRegions);
vacationTravelRegions = xregion(ax, tripTbl.startDate(tripTbl.vacation), tripTbl.endDate(tripTbl.vacation), 'SeriesIndex', 1, 'DisplayName', 'Vacation Travel');
nonVacationTravelRegions = xregion(ax, tripTbl.startDate(~tripTbl.vacation), tripTbl.endDate(~tripTbl.vacation), 'SeriesIndex', 2, 'DisplayName', 'Nonvacation Travel');
hLeg = legend([dailyMileageLine, vacationTravelRegions(1), nonVacationTravelRegions(1)]);

Almost all the instances of high daily mileage occur when I'm traveling for vacation (blue regions) rather than non-vacation travel (orange regions). Vacation travel includes days I worked remotely so that 244-day trip in 2021 was actually only 18 days off work.
To wrap things up, let's add some final touches to the chart. We can use yline to show the different averages for each category and once again leverage the SeriesIndex to match the color of the regions. The ConstantLine which represents the average for when I'm at home can have a SeriesIndex of 'none' to indicate that it's not part of any series and will have a neutral color. Two last tweaks we can do are set AutoUpdate on the legend to 'off' and set TickDir on the axes to 'none'. Turning off AutoUpdate will prevent the ConstantLine objects from being added to the legend automatically and setting TickDir to 'none' will prevent the axes ticks from appearing making the ConstantLine labels easier to read.
dateIntersections = mileageTbl.Date >= tripTbl.startDate.' & mileageTbl.Date <= tripTbl.endDate.';
vacationIdx = any(dateIntersections & tripTbl.vacation.', 2);
nonvacationIdx = any(dateIntersections & ~tripTbl.vacation.', 2);
hLeg.AutoUpdate = 'off';
vacationMean = mean(mileageTbl.Mileage(vacationIdx));
nonvacationMean = mean(mileageTbl.Mileage(nonvacationIdx));
homeMean = mean(mileageTbl.Mileage(~(vacationIdx | nonvacationIdx)));
yline(vacationMean, 'SeriesIndex', 1, 'Label', num2str(vacationMean), 'LabelVerticalAlignment', 'middle');
yline(nonvacationMean, 'SeriesIndex', 2, 'Label', num2str(nonvacationMean), 'LabelVerticalAlignment', 'middle');
yline(homeMean, 'SeriesIndex', 'none', 'Label', num2str(homeMean), 'LabelVerticalAlignment', 'middle');
ax.Title.String = 'I''m more active when I''m away from home';
ax.XLim = [datetime(2021, 1, 1) datetime(2024, 2, 1)];
ax.TickDir = 'none';

Share your thoughts
There are a lot of ways ConstantLine (xline, yline) and ConstantRegion (xregion, yregion) can be used to enhance your visualizations. We would be happy to hear your thoughts on these new features.


Comments
To leave a comment, please click here to sign in to your MathWorks Account or create a new one.