
Stacked Bar3
Stacked Bar3
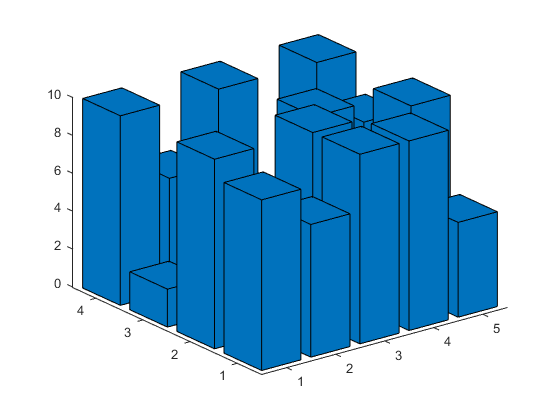
MATLAB's bar3 command is kind of cool, but what if we have a 3D matrix like this?
rng(0)
array = randi(10,[4 5 3]);
It might be nice to create something that was sort of a stacked version of bar3. That seems hard at first, but it's not really that bad. Let's go through one way to do this step by step.
First we get the dimensions of the matrix. We need to know the number of rows (nr) and columns (nc) in each slice, as well as the number slices (ns).
dims = size(array);
switch length(dims)
    case 2
        ns = 1;
    case 3
        ns = dims(3);
    otherwise
        error('Must be a 3D array')
end
nr = dims(1);
nc = dims(2);
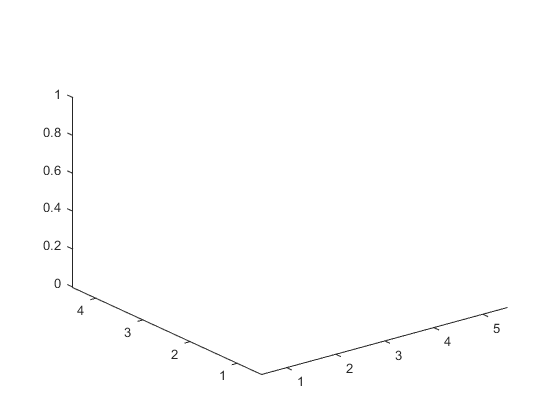
Then we initialize the axes. We want a 3D view with a little extra room on the X and Y limits. We'll also grab the ColorOrder from the axes to use for coloring the slices.
ax = newplot;
view(ax,3)
xlim(ax,[.5 nc+.5])
ylim(ax,[.5 nr+.5])
co = ax.ColorOrder;
We use gobjects to create a matrix to hold the handles to our graphics objects, one for each slice.
h = gobjects(1,ns);
We need a matrix that expands the center of each bar into the four corners. If the width of our bars is .8, then we need to offset + and - .4 in the X & Y directions.
bw = .4;
offmat = [-bw, +bw, 0; ...
          -bw, -bw, 0; ...
          +bw, -bw, 0; ...
          +bw, +bw, 0];
Then we need a matrix that gives us the faces indices for each of the four faces that make up the sides of a bar. This gets a little tricky, so I drew a picture:
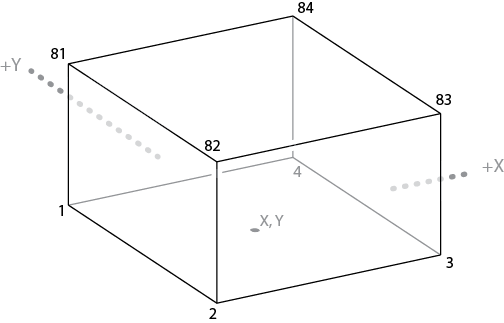
This is the first bar. Its bottom is centered around the point X,Y and it extends a distance bw in each of the positive and negative X & Y directions. We want to put a rectangle on each of the four sides of this bar. Each rectangle visits four of the vertices in clockwise order. So the first one goes [1 2 82 81], and the next one goes [2 3 83 82]. We can make a matrix that represents this for any values of nr and nc like so:
sidemat = [1, 2, 2, 1; ...
           2, 3, 3, 2; ...
           3, 4, 4, 3; ...
           4, 1, 1, 4] ...
        + repmat([0, 0, 4*nr*nc, 4*nr*nc],[4, 1]);
And we'll need one more rectangle to cap off the top of the bar. That looks like this [81 82 83 84]. For any values of nr and nc, that would look like this:
topmat = (1:4) + 4*nr*nc;
We'll also need place to store the Z coordinate of the top of the bars.
top = zeros(dims(1:2));
Start with the first slice. The matrix bottom holds zeros, while the matrix top holds the first slice of our input matrix.
s = 1;
bottom = top;
top = bottom + array(:,:,s);
Since we have 4*5 bars in a slice, we preallocate room for 160 vertices and 100 faces.
verts = zeros(4*nr*nc*2, 3);
faces = ones(5*nr*nc, 4);
Then we fill the verts and faces matrices. To do this, we loop over the rows and columns. For each pair, we use repmat to create 4 copies of a vertex at the center bottom and 4 copies of a vertex at the center top. Then we add offmat to those to get the vertices at the corners.
We also need the face indices. Those are just our sidemat and topmat matrices, plus the number of vertices we've already created.
for r = 1:nr
    for c = 1:nc
        vindex = 4*(r-1 + nr*(c-1));
        verts(vindex +           (1:4)', :) = repmat([c,r,bottom(r,c)],[4,1]) + offmat;
        verts(vindex + 4*nr*nc + (1:4)', :) = repmat([c,r,   top(r,c)],[4,1]) + offmat;
        lindex = 5*(r-1 + nr*(c-1));
        rindex = 4*(r-1 + nr*(c-1));
        faces(lindex + (1:5)',:) = rindex + [sidemat; topmat];
    end
end
Now we're ready to create a patch from those values. We'll pull the FaceColor from the ColorOrder we grabbed earlier, but we need to look out for the case where we have more slices than there are entries in the ColorOrder.
cix = 1+mod(s-1, size(co,1));
h(s) = patch('Vertices', verts, ...
             'Faces', faces, ...
             'FaceColor', co(cix,:), ...
             'Parent', ax);
Repeat this for each slice, copying the old top to the new bottom each time, incrementing s, and doing the above steps again.
bottom = top;
s = s+1;
The result, with a for loop and some error checking, looks like this:
type stacked_bar3
function h = stacked_bar3(array)
    if any(array(:) < 0)
        error('Only positive values supported')
    end

    dims = size(array);
    if any(dims==0)
        error('Empty dimensions are not supported')
    end

    switch length(dims)
        case 2
            ns = 1;
        case 3
            ns = dims(3);
        otherwise
            error('Must be a 3D array')
    end
    nr = dims(1);
    nc = dims(2);

    ax = newplot;
    co = ax.ColorOrder;
    h = gobjects(1,ns);
    view(ax,3)
    xlim(ax,[.5 nc+.5])
    ylim(ax,[.5 nr+.5])

    bw = .4;
    offmat = [-bw, +bw, 0; ...
              -bw, -bw, 0; ...
              +bw, -bw, 0; ...
              +bw, +bw, 0];
    sidemat = [1, 2, 2, 1; ...
               2, 3, 3, 2; ...
               3, 4, 4, 3; ...
               4, 1, 1, 4] ...
            + repmat([0, 0, 4*nr*nc, 4*nr*nc],[4, 1]);
    topmat = (1:4) + 4*nr*nc;

    top = zeros(dims(1:2));
    for s = 1:ns
        bottom = top;
        top = bottom + array(:,:,s);

        verts = zeros(4*nr*nc*2, 3);
        faces = ones(5*nr*nc, 4);
        for r = 1:nr
            for c = 1:nc
                vindex = 4*(r-1 + nr*(c-1));
                lindex = 5*(r-1 + nr*(c-1));
                rindex = 4*(r-1 + nr*(c-1));
                verts(vindex +           (1:4)', :) = repmat([c,r,bottom(r,c)],[4,1]) + offmat;
                verts(vindex + 4*nr*nc + (1:4)', :) = repmat([c,r,   top(r,c)],[4,1]) + offmat;
                faces(lindex + (1:5)',:) = rindex + [sidemat; topmat];
            end
        end

        cix = 1+mod(s-1, size(co,1));
        h(s) = patch('Vertices', verts, ...
                     'Faces', faces, ...
                     'FaceColor', co(cix,:), ...
                     'Parent', ax);

        bottom = top;
    end
end
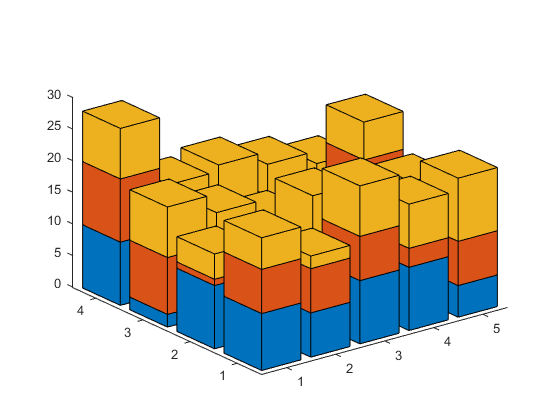
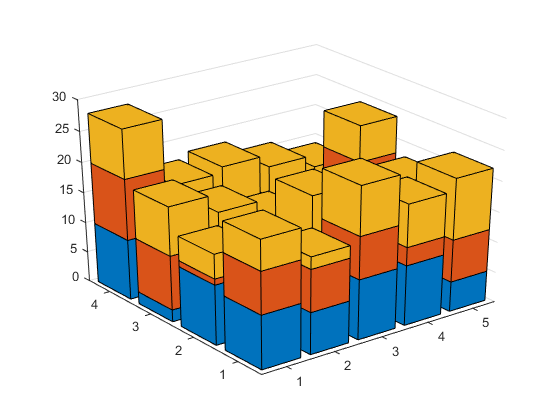
We can call it like this:
stacked_bar3(array);
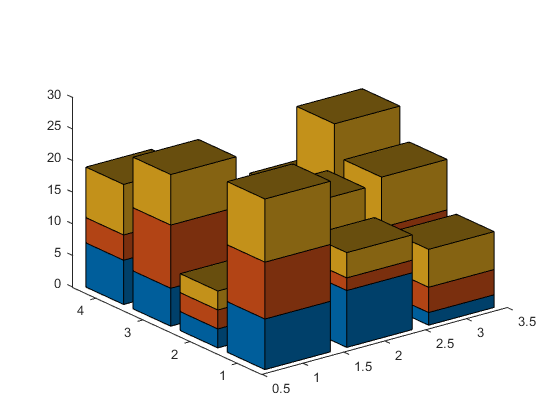
We can also add in features such as perspective ...
ax.Projection = 'perspective';
ax.ZGrid = 'on';
... or lighting ...
h = stacked_bar3(randi(10,[4 3 3]));
light('Position',[-.3 -.2 .8])
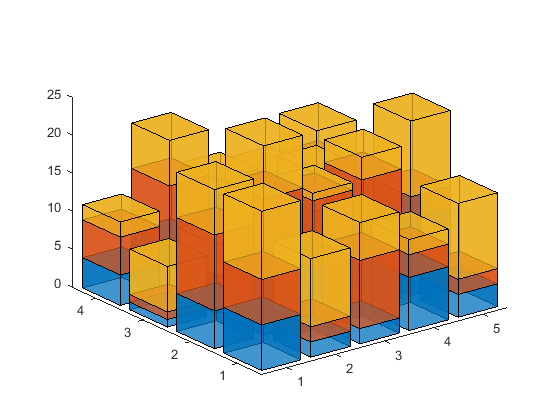
... or transparency, although that currently disables the antialiasing.
h = stacked_bar3(randi(10,[4 5 3]));
alpha(h,.75)
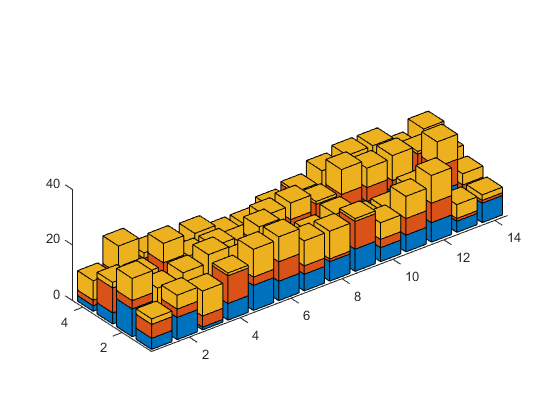
One other thing to consider is the DataAspectRatio. If the numbers of rows and columns are very different, then the bars don't come out square. That looks a little odd:
h = stacked_bar3(randi(10,[4 14 3]));
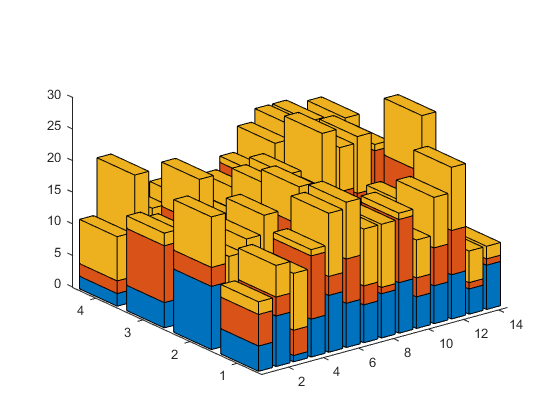
We can adjust that using the daspect function. A value of [1 1 10] means that the X & Y directions should have the same scale, but the scale of the Z direction sould be one tenth of that.
daspect([1 1 10])
- 类别:
- Charts

