
YYAxis
One of the features I love in R2016a is the new yyaxis function. This is a new way to create plots which have two independent Y's, like the older plotyy function. Let's take a look at how yyaxis works, and why I think it's cool.
First we'll need some data. This type of chart is really useful for looking for relationships between data which has wildly different values. For example, I'm interested in the relationship between the price of gas and how much people drive. The Federal Reserve Bank of St. Louis maintains a great collection of historical records of all sorts of economic data like this. I can get the price of what they call "U.S. Gulf Coast, Regular" from this page, and load it into MATLAB using readtable.
tgas = readtable('FRED_DGASUSGULF.xls','Range','A11:B7777');
tgas.observation_date = datetime(tgas.observation_date,'InputFormat','MM/dd/yyyy');
In the same way, I can get Vehicle Miles Traveled from this page.
tnadjmiles = readtable('FRED_TRFVOLUSM227NFWA.xls','Range','A11:B563');
tnadjmiles.observation_date = datetime(tnadjmiles.observation_date,'InputFormat','MM/dd/yyyy');
Now we're ready to start making our plot. If you're used to plotyy, then you would probably think that we need to collect all of our data together and pass it into a special plotting command. But that's not how yyaxis works. Instead, I use the yyaxis function to "select a side of the axes".
yyaxis left

Notice that when I did that, I got a YAxis on each side. A blue one on the left, and a red one on the right.
Now I can use any of the regular MATLAB charting commands to insert a chart into that "side" of the axes. Here I'll use plot and ylabel to create a line chart from my gas prices with units labeled on the YAxis. Notice that the plot is colored to match the YAxis on the left.
plot(tgas.observation_date,tgas.DGASUSGULF)
ylabel('Dollars per Gallon')

Now we can call yyaxis again to switch to the other side, and plot and label my mileage. Notice that this new plot gets the red color of the YAxis on the right.
yyaxis right
plot(tnadjmiles.observation_date,tnadjmiles.TRFVOLUSM227NFWA)
ylabel('Millions of Miles')

We now have the basic chart I wanted, but we have more historical data for the right side than we do for the left side. That doesn't help us look for correlations, so I want to trim it off. To do that, I can switch back to the left side. If I look in the Children property of the Axes, I'll find the plot of gas prices. I can get the limits of its XData and use that as the XLim of the axes. %
yyaxis left
h = get(gca,'Children');
xlim([min(h.XData), max(h.XData)])

Notice that the call to XLim affects both sides of the Axes. That's because there's only one XAxis.
ax = gca;
ax.XAxis
ans =
  NumericRuler with properties:

             Limits: [725525 736396]
              Scale: 'linear'
           Exponent: 0
         TickValues: [1x10 double]
    TickLabelFormat: '%g'

  Use GET to show all properties
But if we look at YAxis, we'll see that it's an array of 2.
ax.YAxis
ans =
  2x1 NumericRuler array:

  NumericRuler
  NumericRuler
This makes it easy to customize all of the tick formats. For example, I'd really like to have the same number of decimal places on all of the Y ticks on the left.
ax.YAxis(1).TickLabelFormat = '%.2f';

And comma separated integers on the right.
ax.YAxis(2).TickLabelFormat = '%,d';
ax.YAxis(2).Exponent = 0;

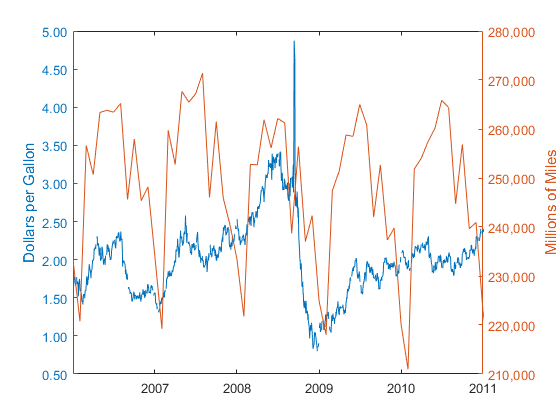
One problem with the mileage data is that it has a lot of seasonal variation. That's because Americans generally drive more in the summer months than they do in the winter. This can make it hard to compare to the gas price data, especially if we zoom in to look at details.
xlim([datenum(datetime(2006,1,1)), datenum(datetime(2011,1,1))])
We could perform a low-pass filter on the data, but the Federal Reserve Bank has already done that for us, so we can just download an additional dataset.
tmiles = readtable('FRED_TRFVOLUSM227SFWA.xls','Range','A11:B563');
tmiles.observation_date = datetime(tmiles.observation_date,'Format','MM/dd/yyyy');
Now we want to add this to our Axes. With plotyy, that would be a little tricky. But with yyaxis, I can just switch to the right side, use hold, and plot the new data.
yyaxis right
hold on
plot(tmiles.observation_date,tmiles.TRFVOLUSM227SFWA)
hold off
xlim([datenum(datetime(2006,1,1)), datenum(datetime(2011,1,1))])

Notice that this new curve is the same red color, but it gets a new line style so we can tell the two plots apart.
legend('Gas price','Miles traveled','Miles/seasonally adjusted')

If I delete the unadjusted mileage data and zoom out, we can see that the Fed's adjusted data only goes back to 2000.
delete(ax.Children(2))
h = ax.Children(1);
xlim([min(h.XData), max(h.XData)])
h.LineStyle = '-';
legend hide

It does look like there's a relationship between the two, but it's important to remember that there was a major recession in this same period. Perhaps that had more effect on the miles traveled than the price of gas did. Let's go back to the FRED data and download the Civilian Unemployment Rate from this page.
unrate = readtable('FRED_UNRATE.xls','Range','A11:B829');
unrate.observation_date = datetime(unrate.observation_date,'InputFormat','MM/dd/yyyy');
And then we'll go to the left side and replace gas prices with unemployment rate.
yyaxis left
plot(unrate.observation_date,unrate.UNRATE)
ylabel('Unemployment Rate')
ax.YAxis(1).TickLabelFormat = '%.1f\%';
xlim([min(h.XData), max(h.XData)])

That pairing looks there might be a relationship, doesn't it? At this point, we're going to want to start statistical analysis of the relationship, but I'm going to skip that. I just wanted to show you how handy the new yyaxis function is for comparing datasets like this.
There's another important difference in yyaxis that I can't really show in a blog post. When I pan an Axes that was created by plotyy, everything pans in lockstep. When I pan an Axes that was created by yyaxis, the XLim of the two sides move together, but only the YLim of the "current" side changes. I found this feature very useful for looking for correlations between these datasets, but we'd really like to hear what you think of the change.
- 类别:
- Charts

