Introducing ISC Earthquake Toolbox
Today’s guest blogger is Kostas Leptokaropoulos. Kostas is the MathWorks Geoscience Academic Discipline Manager, supporting Geoscience researchers and educators. In this blog, he describes his experience working as a researcher seismologist and introduces a new, open toolbox developed by the International Seismological Centre (ISC, England) that enables MATLAB users to work directly with ISC data in MATLAB.
Beyond the Earthquake Catalogues Jungle: Transforming From Data Miner to Seismologist
With over a decade of experience as a seismologist, I've relied heavily on MATLAB for data processing, analysis, and, to some extent, visualization. However, this reliance didn't simplify my work entirely. The laborious tasks of importing, managing, and pre-processing seismic data consumed countless hours. Manually compiling global or regional data from multiple reporting agencies often led to inconsistencies and errors (lots of them!), requiring even more time for review and evaluation. Once finishing with all that, I barely remembered my initial scope and objectives! It felt like I was more data miner than researcher at times. Not to mention my hopeless efforts to write codes for somehow automating the process ...
The recent release of the ISC Earthquake Toolbox adds an important tool for global earthquake parametric data management. The International Seismological Centre (ISC) holds more than 90 GB of unique earthquake data, recorded by ~17,000 seismic stations, reported by over 100 monitoring agencies.

Snapshot from search results in the ISC Bulletin, including event ID, source, focal coordinates, origin time and various magnitude types.
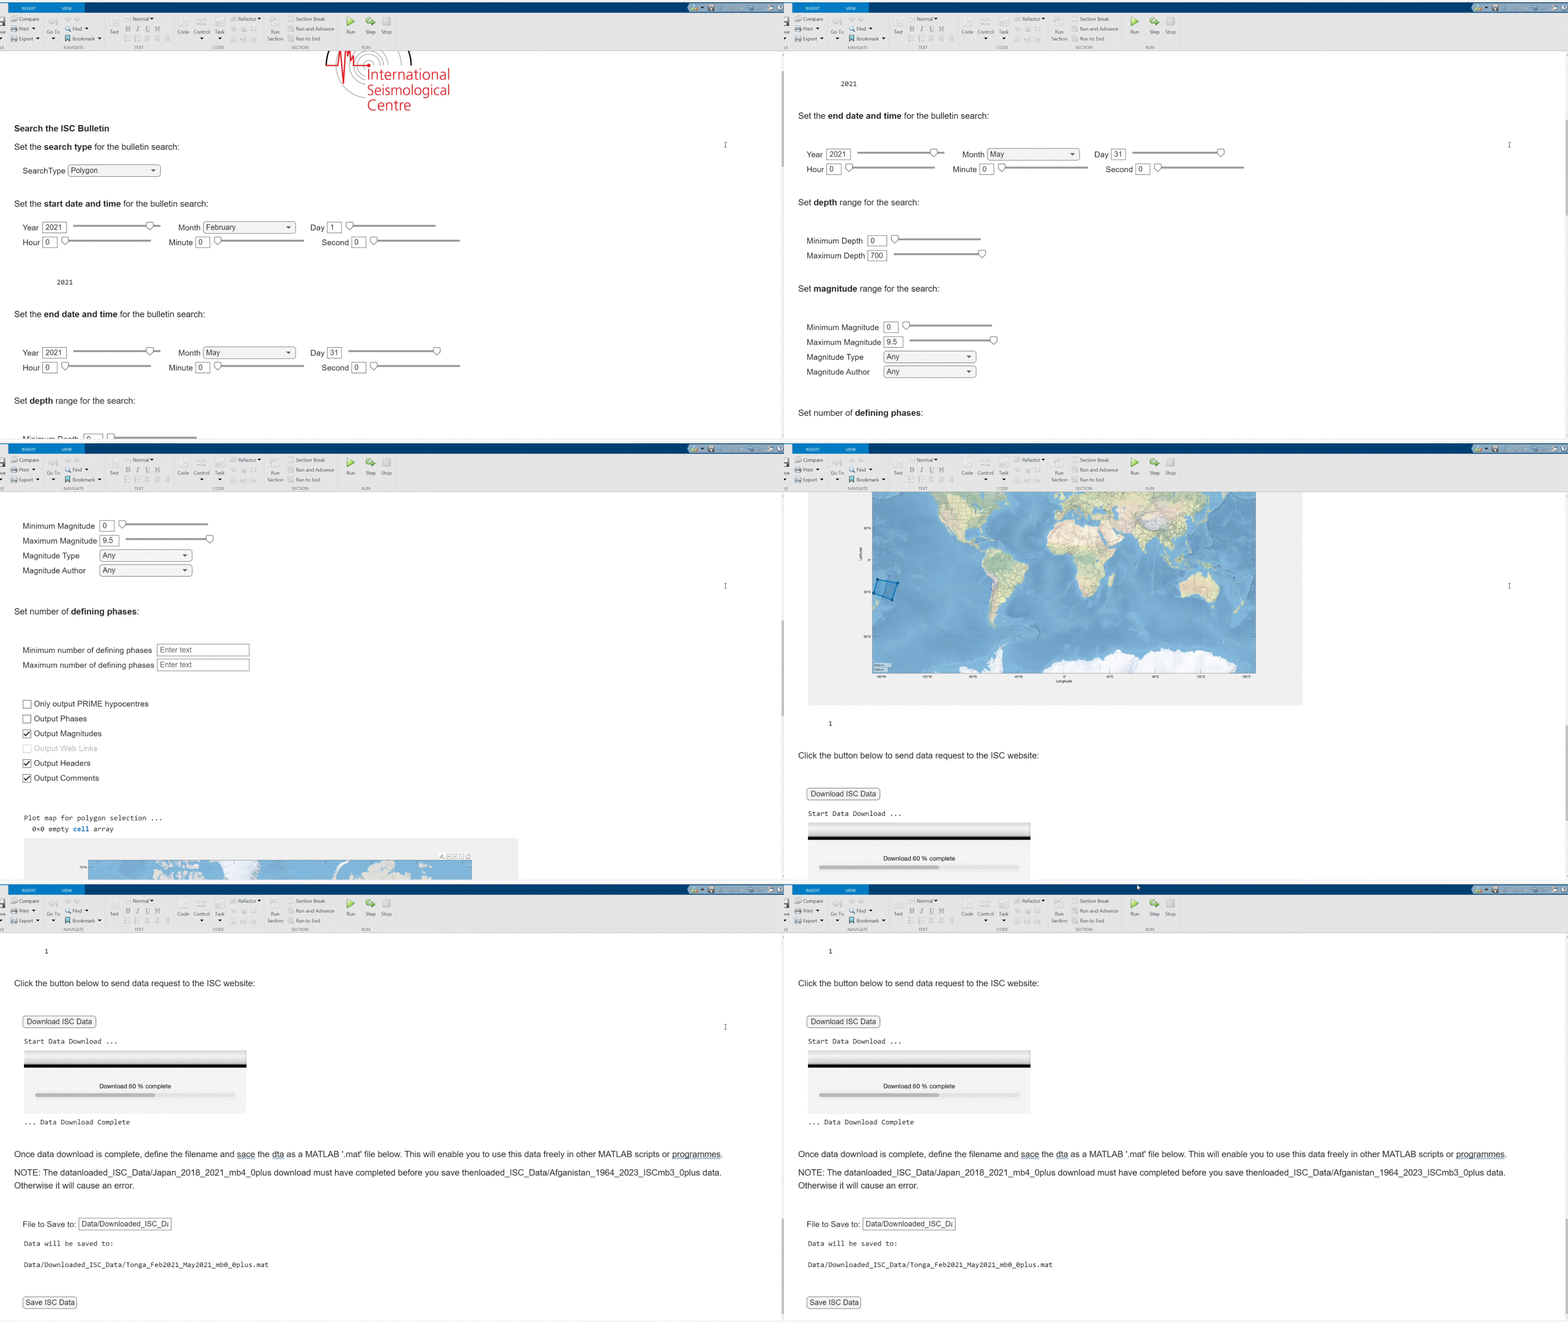
The ISC Earthquake Toolbox, developed by Tom Garth, ISC, is now available to download for free from File Exchange and GitHub. Using ISC Earthquake Toolbox, geophysicists and seismologists can interactively access and visualize ISC Bulletin directly from MATLAB.

The toolbox relies on MATLAB and Mapping Toolbox to provide easy access, filtering, comparison, and visualization of earthquake data from the ISC Bulletin. You can also use the ISC Earthquake Toolbox to
- perform preliminary data analysis such as generating regional seismicity summaries,
- compare earthquake magnitudes,
- calculate b-values,
- evaluate locations reported by different agencies.

A summary map of earthquakes with magnitude larger than 4.0 detected in the Alaskan/ Aleutian subduction zone between 2000 – 2020, plotted in the ISC Earthquake Toolbox.
In my work at university, I also often used ISC data for undergraduate students working on mini-projects. Similarly, professors and students can use ISC Earthquake Toolbox in the classroom, making it more straightforward for students to navigate and select seismological data and then incorporate it into their first research activities. As a result, students can shift their focus away from the data processing to the content and outcomes of their research projects, devoting more time to understanding, analyzing and visualizing data, rather than the cumbersome tasks of data import and management.
Learn more about ISC Earthquake Toolbox
- ISC Earthquake Toolbox (File Exchange, GitHub)
- Getting Started with ISC Earthquake Toolbox (click on “Open in MATLAB Online” to open)
- ISC Bulletin (data)
Questions about ISC Earthquake Toolbox?
Put your comments and questions below or share them on File Exchange


Comments
To leave a comment, please click here to sign in to your MathWorks Account or create a new one.