All about pixel colors
Note
See the following posts for new or updated information about this topic:
Tell me, quick: What are the colors of these pixel values?
| 252 | 249 | 246 | 243 | 237 |
| 255 | 255 | 250 | 246 | 243 |
| 253 | 254 | 248 | 245 | 243 |
| 250 | 249 | 245 | 243 | 239 |
The colors are white and near-white, right?
OK, sorry, that was a trick question. These values aren't taken from a picture at all. They are digital elevation values for locations near Boston. I downloaded the data file from the U.S. Geological Survey web site and read it into MATLAB using the Mapping Toolbox function usgsdem.
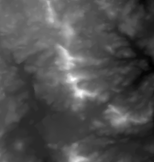
Still, you could certainly display the data set as an image using MATLAB. It might look like this:

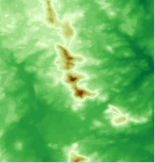
Or maybe like this:

Which brings me back to my original question, which I'd like to rephrase: How does MATLAB associate the value of a particular matrix element with a color displayed on the screen?
I'm going to explore this question over the next few weeks. Specific topics will include:
- The two different pixel-color models in MATLAB. (Or maybe there are three. It depends on how you count.)
- How properties of the figure, axes, and image objects all affect pixel colors.
- Additional pixel-color models in the Image Processing Toolbox.
- The MATLAB and Image Processing Toolbox image display functions and how they work.
A Blog Note
As an experiment, I plan to interleave postings about the pixel-color topic with postings about the spatial transformations topic that I mentioned earlier this week. I'm trying to find a compromise between taking the time to explore a specific topic in depth, and providing material that interests a variety of readers.
We'll see how it goes. As always, feedback is welcome. Please leave a comment!


Comments
To leave a comment, please click here to sign in to your MathWorks Account or create a new one.