Gray scale pixel values in labeled regions
The functions bwlabel and regionprops are very useful for measuring the properties of shapes in a binary image. There are documentation examples and product demos showing how to do this, and I've shown these functions in action several times in this blog.
But sometimes I get questions about how to process pixel values in the "original" gray scale image. In other words, suppose your process is something like this:
- Segment gray scale image to get a binary image of objects
- Label the binary image objects using bwlabel
- Do something with the original gray scale pixel values corresponding to each labeled object
This post is about how to do that last step. Let's start by creating some simple sample images to work with.
I = imread('coins.png');
imshow(I)
bw = im2bw(I, graythresh(I));
bw = imfill(bw, 'holes');
imshow(bw)
title('Thresholded, with holes filled')
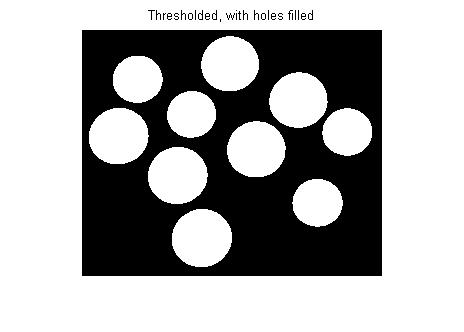
L = bwlabel(bw);
imshow(label2rgb(L, @jet, [.7 .7 .7]))
title('Label matrix')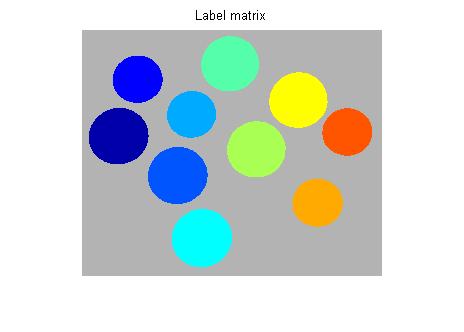
The key for using L to process the pixels in I is to use regionprops to get the 'PixelIdxList' for each labeled region.
s = regionprops(L, 'PixelIdxList')
s =

10x1 struct array with fields:
    PixelIdxList
s is a struct array. s(k).PixelIdxList is a vector of the linear indices of the k-th region. You can use these values to index directly into I. For example, here is the mean pixel value of the 3rd coin:
idx = s(3).PixelIdxList;
mean(I(idx))
ans =

  172.8769
You can also replace object pixel values in I by indexing on the left side of an assignment statement, like this:
% Turn the 4th coin white and the 5th coin black:
J = I;
J(s(4).PixelIdxList) = 255;
J(s(5).PixelIdxList) = 0;
imshow(J)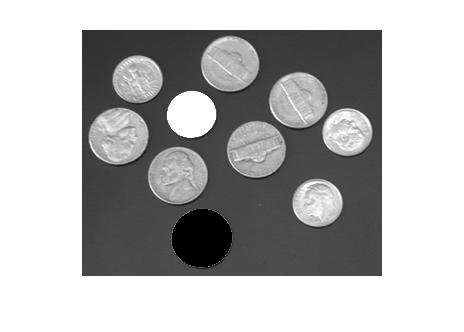
Here's a loop that replaces the pixel values for each coin by the mean pixel value for that coin:
F = I;
for k = 1:numel(s)
    idx = s(k).PixelIdxList;
    F(idx) = mean(I(idx));
end
imshow(F)
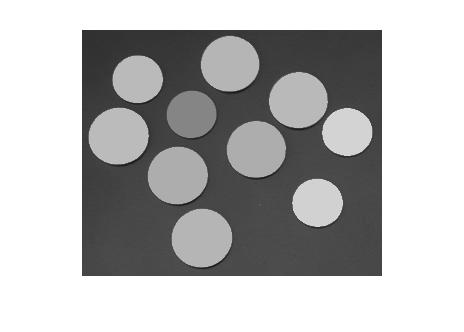
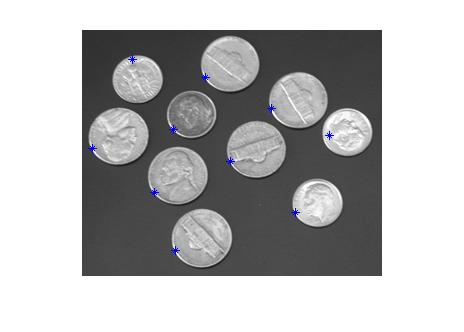
I'll finish with a question that Mat asked in a blog comment: "How can I find the location of the maximum pixel value in each labeled region?" Here's how to find the locations and then plot them on top of the original image. (In addition to 'PixelIdxList', I'll also ask regionprops for 'PixelList', which gives the x and y coordinates of each pixel in the region.)
s = regionprops(L, 'PixelIdxList', 'PixelList');
imshow(I)
hold on
for k = 1:numel(s)
    idx = s(k).PixelIdxList;
    pixels_in_region_k = I(idx);
    [max_value, max_idx] = max(pixels_in_region_k);
    max_location = s(k).PixelList(max_idx, :);
    plot(max_location(1), max_location(2), '*')
end
hold off




评论
要发表评论,请点击 此处 登录到您的 MathWorks 帐户或创建一个新帐户。