Intensity-weighted centroids
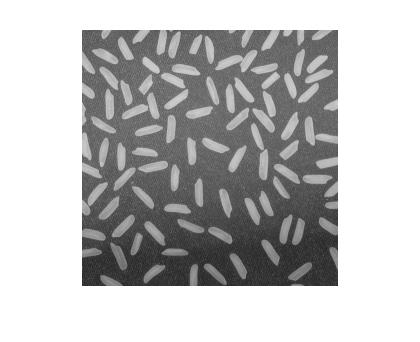
One the measurements provided by regionprops is 'Centroid'. Here's an example of labeling binary objects, computing the centroid of each object, and plotting the centroid location on top of the image.
I = imread('text.png');
imshow(I)
L = bwlabel(I);
s = regionprops(L, 'Centroid');
hold on
for k = 1:numel(s)
    plot(s(k).Centroid(1), s(k).Centroid(2), 'r*')
end
hold off
xlim([0 60])
ylim([0 60])

Last week, reader Daphne asked how to compute the intensity-weighted centroid. That is, if each labeled region corresponds to a region in a gray scale image, how do you compute the centroid weighted by the gray scale pixel values? The easiest way, I think, is to use the both the PixelIdxList and PixelList properties from regionprops. Let's try it with a simple synthetic image (download the image from here):
I = imread('spheres.png');
imshow(I)
Now let's threshold and label it:
bw = I < 255;
bw = imfill(bw, 'holes');
L = bwlabel(bw);
imshow(label2rgb(L, @jet, [.7 .7 .7]))
Next, get the PixelIdxList and PixelList for each labeled region:
s = regionprops(L, 'PixelIdxList', 'PixelList');
Each row of the PixelList for a region contains the x and y coordinates of a pixel in that region.
s(1).PixelList(1:4, :)
ans =

    48    94
    48    95
    48    96
    48    97
We can get the grayscale value of pixels in a region by indexing into I with PixelIdxList. By weighting those values with the x and y coordinates, we can compute the centroid.
idx = s(1).PixelIdxList;
sum_region1 = sum(I(idx));
x = s(1).PixelList(:, 1);
y = s(1).PixelList(:, 2);

xbar = sum(x .* double(I(idx))) / sum_region1
xbar =

   74.6128
ybar = sum(y .* double(I(idx))) / sum_region1
ybar =

   92.5121
Let's do that in a loop and superimpose the centroid locations on the image.
imshow(I)
hold on
for k = 1:numel(s)
    idx = s(k).PixelIdxList;
    pixel_values = double(I(idx));
    sum_pixel_values = sum(pixel_values);
    x = s(k).PixelList(:, 1);
    y = s(k).PixelList(:, 2);
    xbar = sum(x .* pixel_values) / sum_pixel_values;
    ybar = sum(y .* pixel_values) / sum_pixel_values;

    plot(xbar, ybar, '*')
end
hold off


コメント
コメントを残すには、ここ をクリックして MathWorks アカウントにサインインするか新しい MathWorks アカウントを作成します。