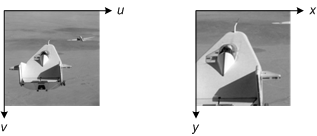
Viewing output-space coordinates for a transformed image
Blog reader Ram asked a question last week that I hear fairly often: When you apply a spatial transformation to an image, how can you see the x-y coordinates when you display the image?
The answer has three steps:
1. Ask imtransform for the spatial coordinates of the output image
2. Give imshow the spatial coordinates when you display the output image
3. Turn on the axis box and tick labels
Let's walk through these steps using an affine transformation.
T = maketform('affine',[.5 0 0; .5 1.5 0; 100 200 1]);
I = imread('cameraman.tif');
The first output from imtransform is the transformed image. There are two more optional arguments, though: xdata and ydata. xdata is a two-element vector specifying the x-coordinates of the first and last image columns. Similarly, ydata specifies the y-coordinates of the first and last image rows.
[I2, xdata, ydata] = imtransform(I, T);
xdata
xdata =

   101   356
ydata
ydata =

  201.5000  584.5000
Step 2 is to pass the coordinate information to imshow. You can do that by using the 'XData' and 'YData' parameters, like this:
imshow(I2, 'XData', xdata, 'YData', ydata)

But we still can't see the coordinates! That's because imshow turns the axis display off. That brings us to step 3: Turn on the axis box and tick labels:
axis on
After you do these steps, you might also want to call impixelinfo, which turns on a display of pixel location and value in the figure window. The display updates as you move the mouse.


댓글
댓글을 남기려면 링크 를 클릭하여 MathWorks 계정에 로그인하거나 계정을 새로 만드십시오.