What color is green?
"Why do you have M&Ms on your desk?" my friend Nausheen wanted to know. Well, the truth is, for playing around with color images, M&Ms are simply irresistable.
url = 'https://blogs.mathworks.com/images/steve/2010/mms.jpg';
rgb = imread(url);
imshow(rgb)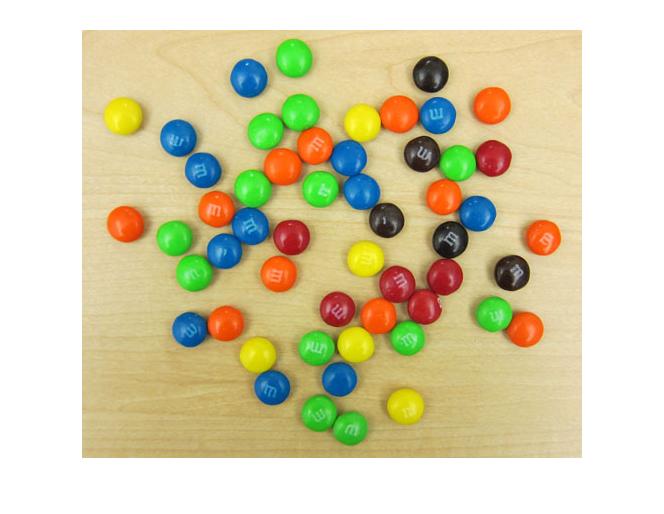
I can think a few different things we could try with this image. First let's tackle the question, "What color is green?"
That is, can we quantify the color of the green M&Ms? There are a couple of challenges. The first is that there is some variation in lighting in this image from top to bottom. For example, suppose we pick two pixels from within the regions marked below:
imshow(rgb)
hold on
plot(212, 26, 'wo', 'MarkerSize', 12)
plot(235, 378, 'wo', 'MarkerSize', 12)
hold off
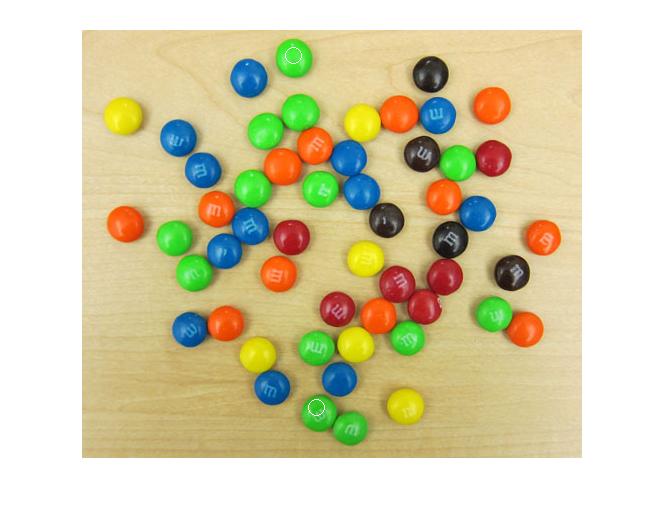
Let's display an image containing two giant pixels, one chosen from the upper M&M and the other chosen from the lower one.
twopixels = [rgb(26,212,:), rgb(378,235,:)];
imshow(twopixels, 'InitialMagnification', 'fit')

You can see that's quite a difference in shade. But even within the same M&M there's a lot of color variation. Let's examine two pixels on a single M&M.
imshow(rgb)
axis([220 250 370 400])
hold on
plot(228, 382, 'wo', 'MarkerSize', 12)
plot(237, 389, 'wo', 'MarkerSize', 12)
hold off

twopixels = [rgb(382,228,:), rgb(389,237,:)];
imshow(twopixels, 'InitialMagnification', 'fit')

So where do we go from here? Well, next time I'll probably explore one or two other color spaces, and I also plan to show you how to compute and display a two-dimensional histogram.




コメント
コメントを残すには、ここ をクリックして MathWorks アカウントにサインインするか新しい MathWorks アカウントを作成します。