
Making your plot lines thicker
Today's blog post is dedicated to everyone whose eyes aren't as young as they used to be.
In last week's blog post on pursuit curves, I showed this figure:

If you ran my code exactly as I posted it, though, you probably wouldn't see exactly the same thing. You would see something like this instead:
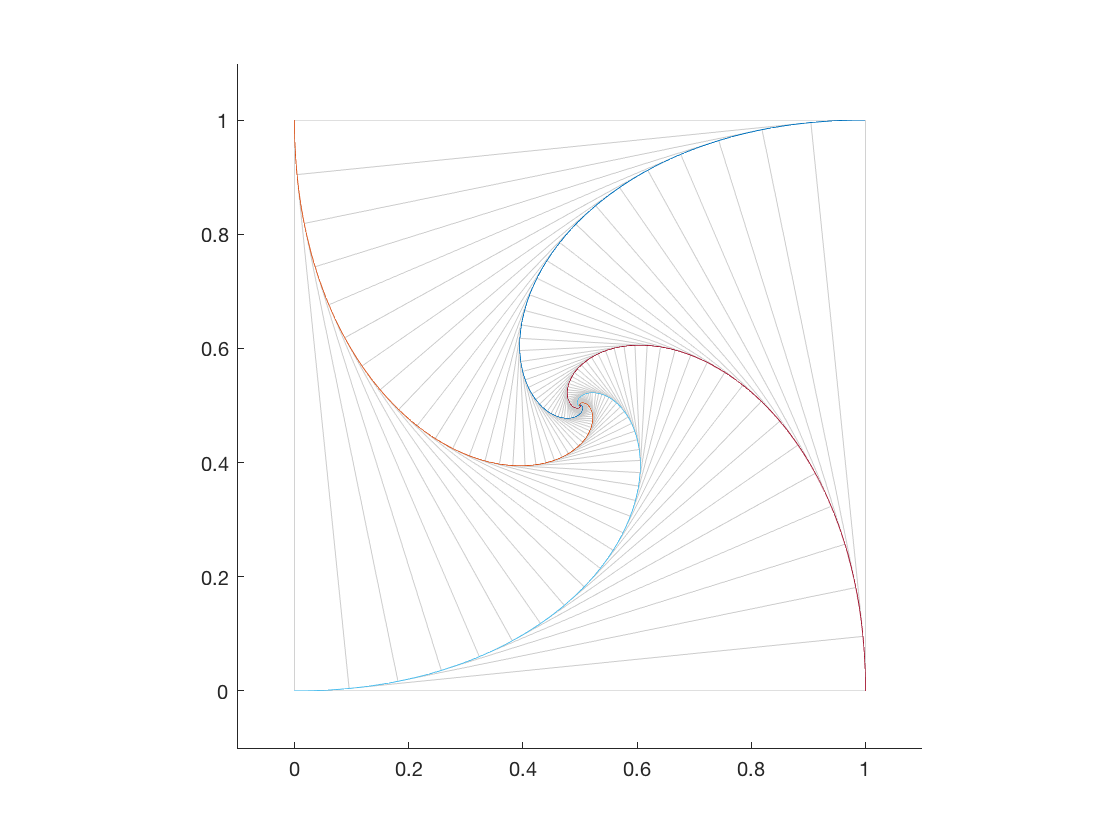
Do you see the difference? Exactly what you see will vary depending on your computer and your display resolution, but the original image from my blog post has thicker colored lines.
That's because I don't use the default line thickness for my plots.
Let me show you what I mean. Here's a basic example of plot from the MATLAB documentation:
x = linspace(-2*pi,2*pi);
y1 = sin(x);
y2 = cos(x);

figure
plot(x,y1,x,y2)
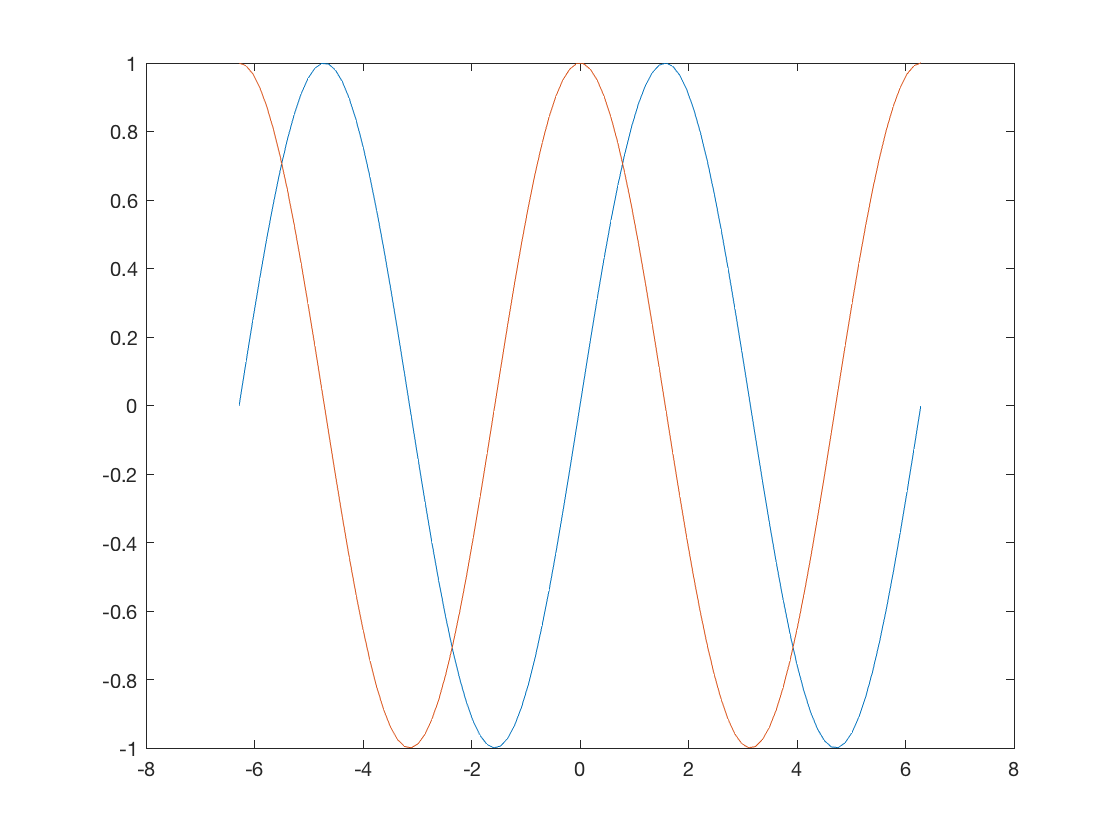
The plot above uses the default MATLAB line width of 0.5 points. Here's where I have to wave my hands a little. Because of the way the figure above was captured for display in your browser, the lines probably appear a little thicker than 0.5 points. On a high resolution display, however, the plotted lines are pretty close to 0.5 points thick.
And, to my eyes, that's too thin to see the colors clearly.
So, I like to plot thicker lines, roughly 1.5-2.0 points. You can do that in each call to plot by using the LineWidth parameter, like this:
plot(x,y1,x,y2,'LineWidth',2.0)

But then you have to remember to add the LineWidth parameter all the time. It turns out that there's a way to get MATLAB to draw all plotted lines thicker by default. Here it is:
set(groot,'defaultLineLineWidth',2.0)
This odd-looking line of code sets the default LineWidth property for line objects to 2.0. For a full explanation of the MATLAB system for setting default graphics object properties, see Default Property Values in the MATLAB documentation.
Update: Using a thicker line width might only work well for high-DPI monitors. Blog reader Gang Yao pointed out that using 2-pt. lines can make markers indistinct, and I can confirm that observation when not using a high-DPI monitor. After some additional experimentation, I found that using 1.5-pt. lines on a high-DPI monitor works a little better.
This default setting does not persist between MATLAB sessions, though. If you want to do this for each MATLAB session, put the call to set into a file called startup.m that is located in your user path folder. Run the userpath function to see where that is. Here's mine:
userpath
ans =

    '/Users/steve/OneDrive - MathWorks/MATLAB'
You can also use the userpath function to change your user path location, if you don't like the default location chosen by MATLAB. (That's what I did.)
For more information, see the function reference pages for startup and userpath.
Do you like thicker plotted lines too? Or is it just me?


コメント
コメントを残すには、ここ をクリックして MathWorks アカウントにサインインするか新しい MathWorks アカウントを作成します。