A new image tiling function in MATLAB
I was noodling around recently with a future blog topic (multiresolution pyramids; stay tuned) when I was reminded of a recent addition to MATLAB: the function imtile, introduced in R2018b.
This function has an interesting design history. (Interesting to me, anyway.) The Image Processing Toolbox team has moved several functions into MATLAB over the past few years to support basic image processing workflows in products such as the Deep Learning Toolbox. Examples include imshow, imresize, and rgb2gray. For similar reasons, the team was acting on a request to move the montage function into MATLAB. This prompted a review of the function's design.
And, well, we weren't convinced that the montage function was what we really wanted to put into MATLAB.
This function is one of the oldest functions in the toolbox, dating back to the initial version 1.0 release in 1993. It's been steadily tinkered with over all those years, but the function we have today still isn't meeting everyone's needs. It is also a little confused about whether it is primarily a display function or a computation function. It tries to do both, but using it as a computation function is awkward.
So, the team took a fresh look at all the sources of feedback we have about montage. For example, there are a lot of questions and discussions about montage on MATLAB Answers. The team wrote internal design documents summarizing the feedback.
As I reread those documents to prepare this post, I thought that two pains associated with montage particularly stood out. The first pain is that, as I mentioned above, it is awkward to get the tiled image that montage creates because montage doesn't return it directly as an output argument. Instead, you have to get the CData property of the image object that montage displays on the screen.
The second pain is that it's very difficult to achieve adequate control over the resolution of the tiled image, especially when the tiled image has more pixels than the display.
Following this analysis, the toolbox team recommended a new function, imtile, that would act purely as a computation function. It creates and returns a new array of pixels, using exactly the original image pixels - The new function does not display anything. If you want to write a script that tiles images and writes the result to a file, with no intermediate result appearing on the screen, you can easily do it with imtile. If you want to display the tiled result, use imshow.
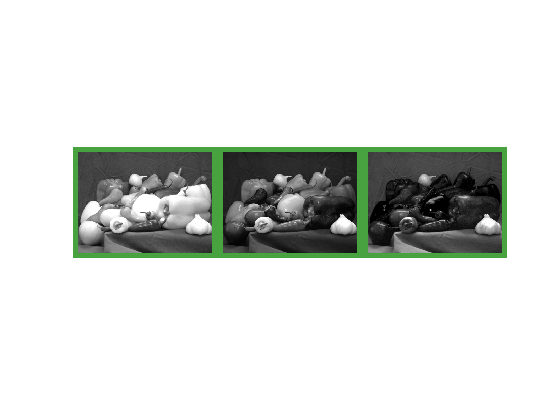
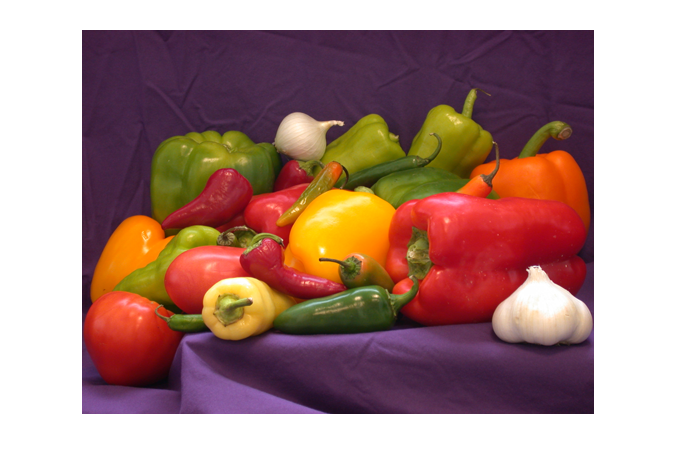
Here is a little snippet of code that creates a tiled image out of the three color components of the peppers.png image. The code specifies the size of the border to be used between the tiles, the background color between the tiles, and the size of the tile grid. Then the code displays the tiled image using imshow.
rgb = imread('peppers.png');
tiled_components = imtile(rgb,'BorderSize',20,...
    'BackgroundColor',[72 162 63]/255,...
    'GridSize',[1 3]);
imshow(tiled_components)

The array returned by imtile can be written directly out to an image file.
imwrite(tiled_components,'tiled_components.png')
I hope you find that the new function is a useful addition to MATLAB.


コメント
コメントを残すには、ここ をクリックして MathWorks アカウントにサインインするか新しい MathWorks アカウントを作成します。