MATLAB, Landsat 8, and AWS Public Data Sets
A few weeks ago, a fellow developer (Kelly Luetkemeyer) pulled me into his office to show me something he had been working on. It was very cool! Even better, it's now available for you to try. I'd like to introduce guest blogger Bruce Tannenbaum, product marketing manager for image processing and test & measurement applications, to tell you all about it. Thanks, Bruce!
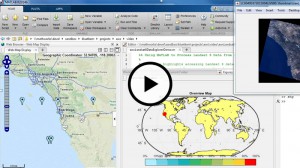
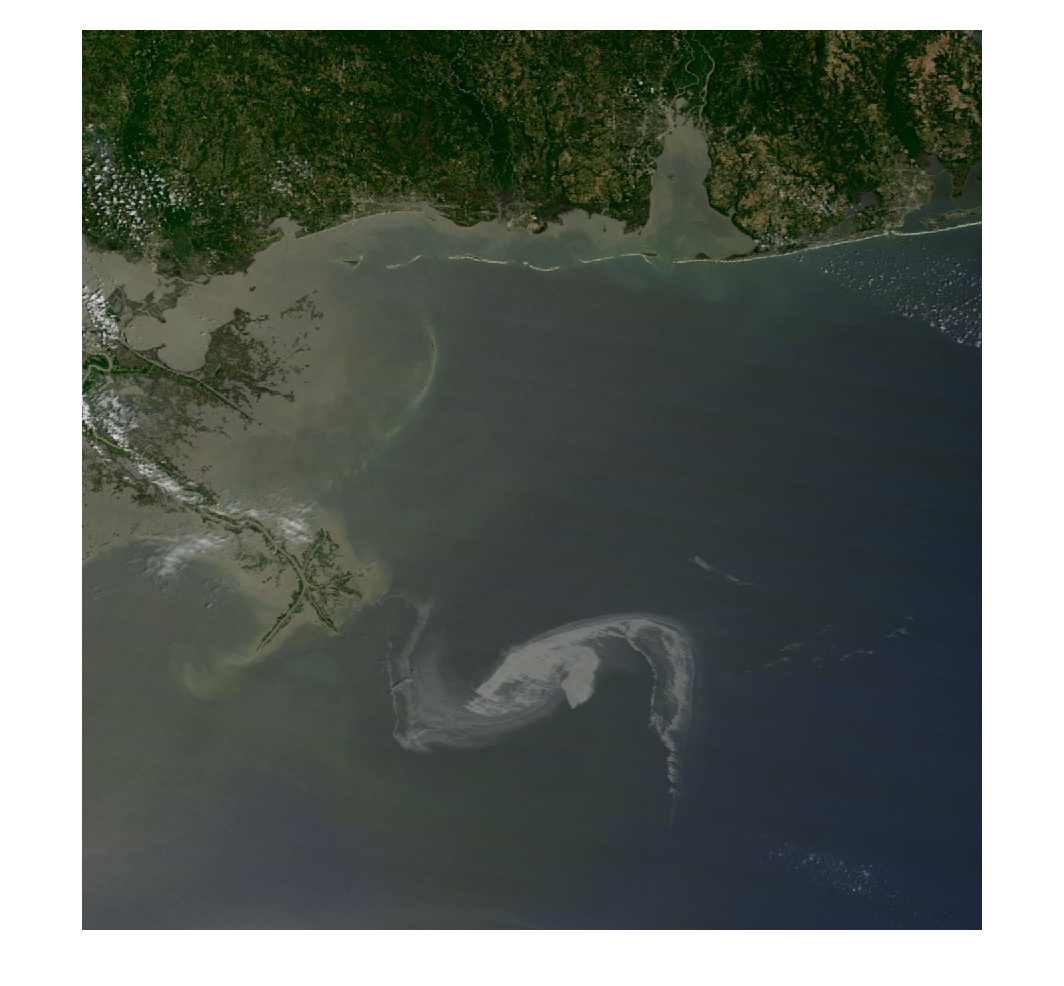
MathWorks is excited to announce a freely-downloadable MATLAB based tool for accessing, processing, and visualizing Landsat 8 data hosted by AWS as part of its Landsat on AWS Public Data Sets. With this tool, you can create a map display of scene locations with markers that show each scene’s metadata. You can download and visualize thumbnails and any of the 11 spectral bands. The tool includes clickable links for automatically combining and processing spectral bands in a variety of approaches, such as NDVI and color infrared. You can then visualize processed results in MATLAB and create map displays that help convey context about where the data is located on the Earth. This interactive tool is available on MATLAB Central. Watch the video below to see it in action.
How MATLAB and Landsat 8 Work Together
MATLAB provides a great environment for working with Earth observation data. It supports a wide range of file formats, including the GeoTIFF format used for Landsat 8 imagery. It supports accessing Earth science data over the Internet, such as the http requests used by AWS Public Data Sets. The Image Processing Toolbox extends MATLAB with a comprehensive set of image processing algorithms and tools for image processing, analysis, visualization, and algorithm development. The interactive tool for Landsat 8 imagery takes advantage of processing techniques in the toolbox, such as adaptive histogram equalization.
One challenge of working with Landsat 8 imagery is that you need to know where each scene is located. A scene represents a specific time and a rectangular surface region of about 185 by 180 kilometers. To make it easier to locate scenes, our tool creates a map display with markers showing the centroid of each scene within the field of view. Additionally, the tool color-codes the markers to show cloud coverage, which is encapsulated in the metadata file for each scene. The most useful images have low cloud coverage; the tool makes it easy to find images with 0-10% or 10-20% cloud coverage, which are the areas that are clearest.
In summary, Landsat 8 is an incredible resource for global change research and has been used in a diverse array of scientific endeavors including the monitoring of deforestation, population growth, and glacier recession. The tool offers a great way for MATLAB users to build on the foundation of AWS support for Landsat 8 imagery. It can also be run on an EC2 instance, which avoids the download time and allows you to process many images in a shorter amount of time. MathWorks would like to hear your feedback, including any additional features you would like to have.


Comments
To leave a comment, please click here to sign in to your MathWorks Account or create a new one.