Anticipating Official U.S. Census for 2020
On October 13, the U.S. Supreme Court ruled that the U.S. Census Bureau could stop the 2020 census early. Here is a link to just one of many recent news articles about the census, New York Times.
I like to use data from the U.S. census as an example for curve fitting. Three years ago, I wrote about the census in MathWorks News & Notes and in this blog. It's time for an update.
Contents
1900-2010
We begin with twelve data points, the U.S. Census counts every ten years between 1900 to 2010. The units are millions of people.
   1900    75.995
   1910    91.972
   1920   105.711
   1930   123.203
   1940   131.669
   1950   150.697
   1960   179.323
   1970   203.212
   1980   226.505
   1990   249.633
   2000   281.422
   2010   308.746
2020
One of the experiments in Cleve's Laboratory is censusapp. Recent versions have invited you to extrapolate to 2020. A dozen of the fits, including high degree polynomials, fail spectacularly with extrapolation. Only five models provide reasonable predictions of the count in 2020.
  quadratic  342.047
  cubic      341.125
  quartic    332.066
  pchip      331.268
  logistic   339.595
makima
A few years ago we introduced a third cubic spline, makima, in MATLAB. My colleague Cosmin Ionita wrote about makima in this blog post. The model is a modification of work from 1970 by Hiroshi Akima. The three splines, spline, pchip and makima, primarily differ in the way they handle the tradeoff between smoothness and oscillations. Two of them, spline and makima, generalize to many dimensions, while pchip does not.
The three splines also have different ways of handling conditions at the ends of the interval. This is key when we use them for extrapolation. Good behavior outside the interval is not any spline's strength, but for the census data makima gets lucky. So, add this line to the five above.
makima 329.810
pop clock
There is no reason to believe that populations behave like cubic polynomials in time. The U.S. Census Bureau has a more realistic model. Their model drives the population clock available at their web site, popclock.
The U.S. population is now growing at a rate of roughly 1.6 million people per year. Theoretically, the census measures the population on April 1 of a particular year. At the bottom of the first window of popclock is a clickable link with a tiny calendar labelled "Select a Date". Go back to April 1, 2020. The model says the population on that date was
popclock 329.459
This is not yet the official value that will be produced by the 2020 census. For that, we have to wait for an announcement.
All of our models overestimate the popclock value. Surprisingly, makima happens to be closest. My post and newsletter article three years ago began by citing a headline in the New York Times, "Growth of U.S. Population Is at Slowest Pace Since 1937". None of our models have any notion of this trend. The end point conditions in pchip and makima produce cubics that are used for extrapolation. These cubics have a negative second derivative and so their growth rate is also slowed.
2030
An interesting note available from the U.S. Census Bureau points out that "the year 2030 marks a demographic turning point for the United States. Beginning that year, all baby boomers will be older than 65."
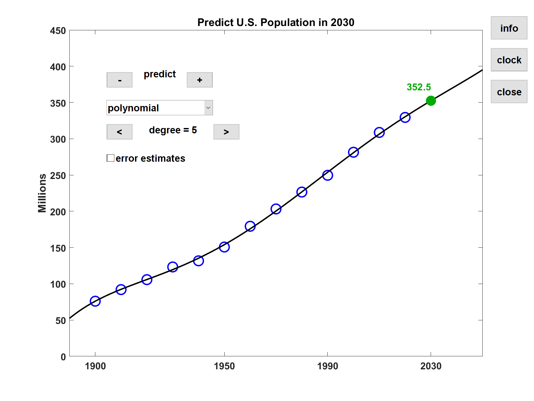
I have added the popclock value to the data used by censusapp and now suggest extrapolation to 2030. The code is included in the version of Cleve's Laboratory that is now available from MATLAB Central File Exchange. All three splines paint a gloomy picture for 2030. Perhaps the extrapolation by the fifth degree polynomial seen in this censusapp screen shot will turn out to be prophetic.


评论
要发表评论,请点击 此处 登录到您的 MathWorks 帐户或创建一个新帐户。