
What’s New in MATLAB R2026a for Economists
R2026a covers a lot of ground for economists—Bayesian state-space estimation, macro-scale forecasting, climate and physical risk mapping, symbolic dynamics, and AI-assisted model review, among others.
This post is not a comprehensive list. It is a short, practical tour through a few highlights that make economic modeling workflows easier to work with—and easier to trust—when models need to be reused rather than rewritten.
Links are included so you can go deeper into the areas that matter most to your work.
If you would like to explore how these apply to your models, contact us to start a conversation.
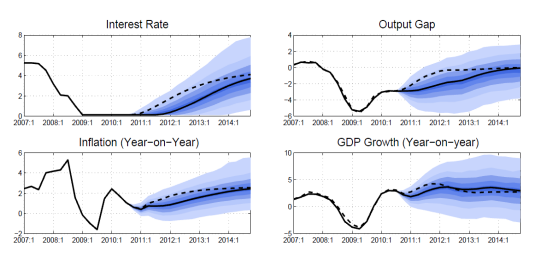
Build and Estimate Bayesian and State-Space Econometric Models
R2026a includes a major update to Econometric Modeler, focusing on the full lifecycle of time‑series and state‑space analysis: from exploration and diagnostics, through simulation and forecasting.
What’s new
- A redesigned Econometric Modeler workflow with improved diagnostics, and support for deterministic and simulation-based forecasting
- Expanded non-linear state-space modeling, including new Sequential Monte Carlo proposal options such as auxiliary filtering and unscented Kalman filter–based proposals
- New random effects panel data modeling with fitrepanel
Example uses
Macroeconomic foundations · stochastic forecasts · recession/expansion regime analysis · macro panel regression
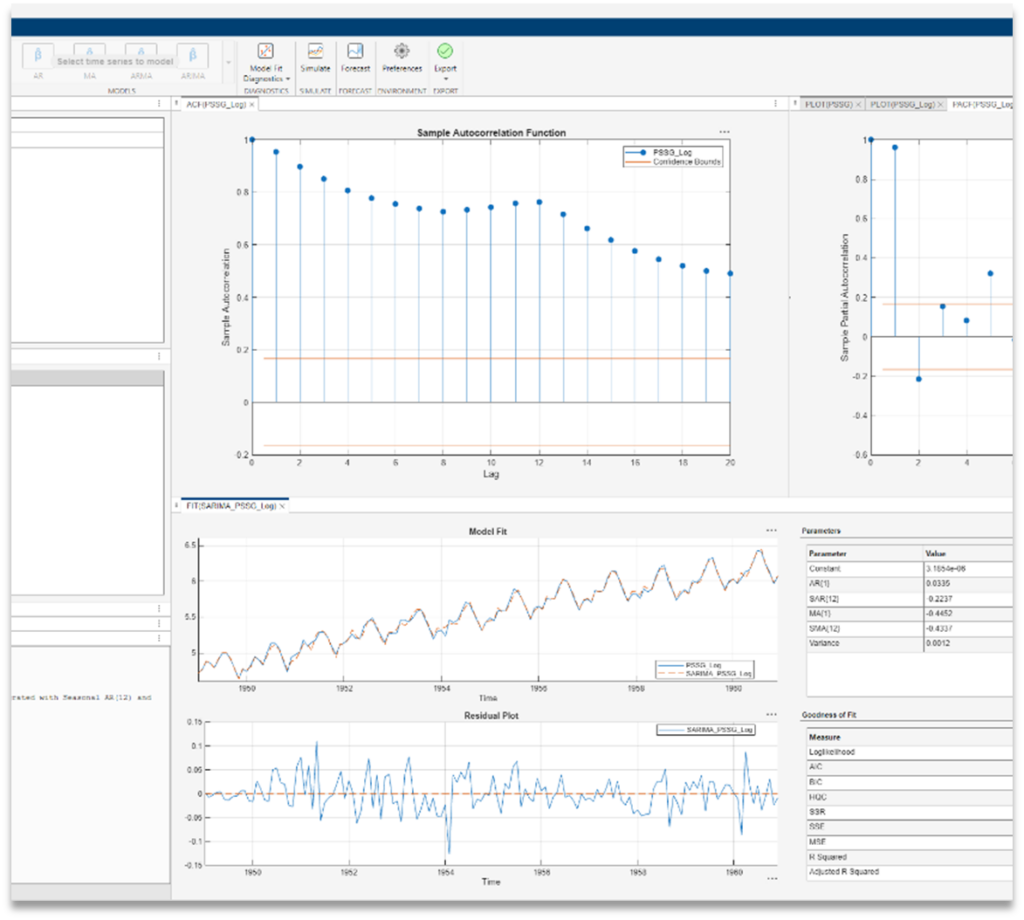
These updates are part of Econometrics Toolbox
Map Climate and Physical Risk to Financial Exposures
Climate risk analysis often starts with spreadsheets and quickly turns into a geography problem.
- Where are the exposures located?
- How do hazards overlap with portfolios?
- How do you communicate those results clearly?
What’s new
- Display hazard rasters with geoimage and geopcolor
- Build exposure heatmaps as pseudocolor rasters
- Add 3D OpenStreetMap buildings for geographical context
- Access expanded public hazard layers via WMS (Web Map Service)
Example uses
Mortgage and commercial real estate (CRE) risk maps · exposure hotspots · climate risk reporting
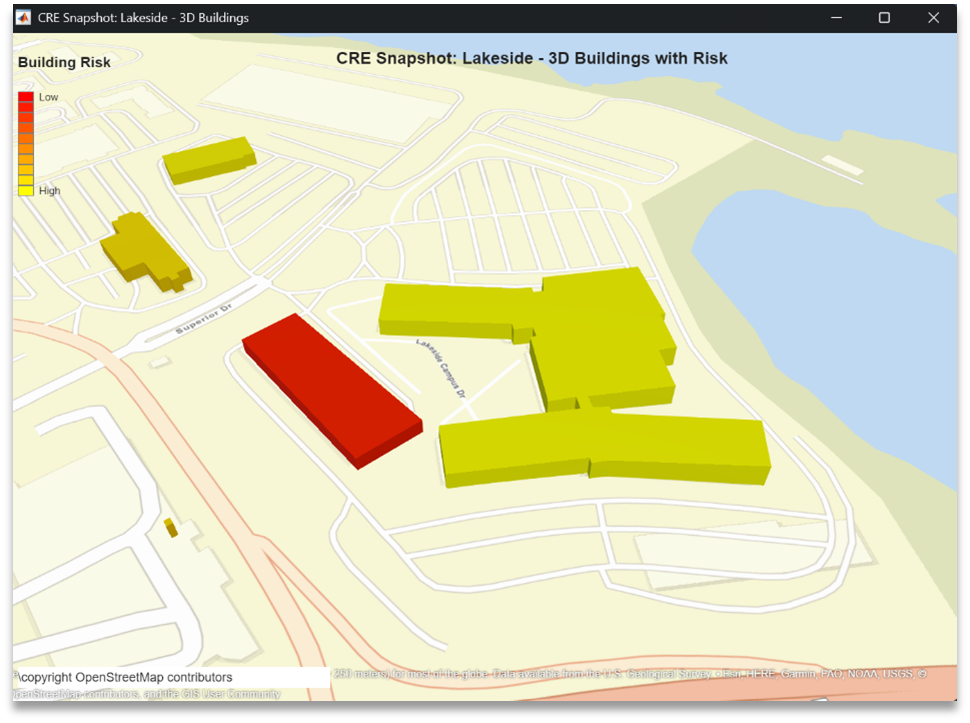
These capabilities are provided by Mapping Toolbox
Integrate MATLAB into Agentic AI Workflows
Econometric models are increasingly reviewed, tested, and discussed alongside AI tools, but that only works if the models themselves stay grounded, executable, and auditable.
R2026a introduces a standardized way to integrate MATLAB into agentic AI workflows, so AI tools can interact with real models rather than static code snippets.
What’s new
- A standardized Model Context Protocol (MCP) interface for tools such as Claude, Gemini, Visual Studio Code, and GitHub Copilot
- Built-in tools for code execution, testing, and toolbox detection
Example uses
Reviewing macroeconomic model code · debugging state-space and forecasting workflows · generating econometric analysis.
This workflow is enabled by the MATLAB MCP Core Server
Analyze Economic Dynamics Symbolically
Sometimes you don’t want another simulation.
You want the equation.
R2026a expands symbolic capabilities that support closed‑form analysis of dynamic systems—useful for validating models, checking assumptions, and understanding outputs.
What’s new
- Solve linear recurrences relations and systems
- Support for selected non-linear and multiplicative forms
- Closed-form solutions with initial conditions, or use substitution to solve non-computable recurrence.
Example uses
Dynamic stochastic general equilibrium (DSGE) or growth model analytic checks · dynamic path formulas · verifying iterative solvers
These features are available in Symbolic Math Toolbox
Prototype Time-Series Forecasts Without Writing Code
Forecasting often starts with exploration.
What model works? How sensitive is it? Does a nonlinear approach help?
R2026a continues to support low‑code forecasting workflows that let economists prototype quickly — and compare modern neural approaches with classical time‑series methods.
What’s new
- Build LSTM and other neural time-series models without code
- Compare neural forecasts with classical approaches such as ARIMA
- Training diagnostics, overfitting detection, and automatic code export
Example uses
Nonlinear forecasting · rapid prototyping
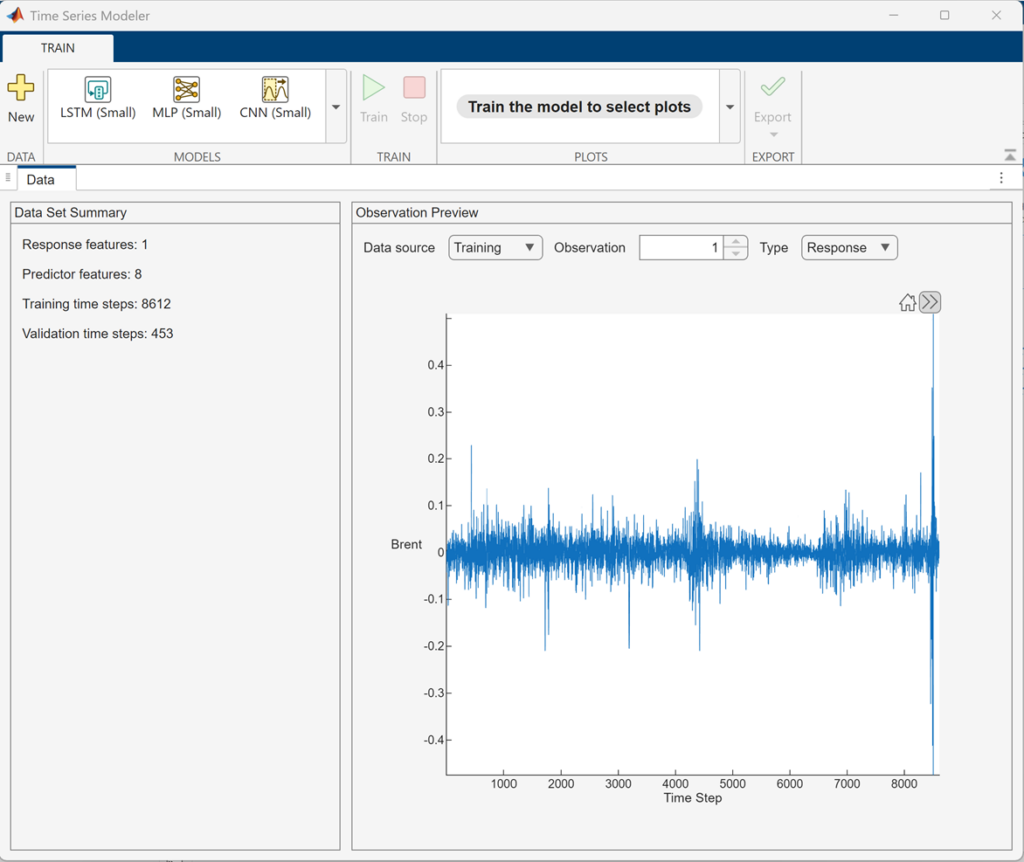
Time Series Modeler app is included in Deep Learning Toolbox
Enhanced Day-to-Day Research in MATLAB
Some of the most valuable changes show up in the background – in data handling, interoperability, and performance. R2026a includes several updates that smooth the day‑to‑day work of economic research.
Data Access & Interoperability
- JSON import/export to tables and timetables
- Unified Python environment management via the External Languages panel
Data Preparation & Exploration
- More flexible outlier detection in Live Scripts and the Data Cleaner app
- Improved missing‑data handling (mean, median, mode)
- Percentiles and quantiles for datetime and time‑series data
Modeling & Numerical Analysis
- Automatic differentiation for Jacobians in dynamic economic models
- Support for stiff and implicit dynamic systems (IDAS solver)
Visualization & Communication
- Raincloud plots for distributional analysis
- Interactive figures exportable as standalone web graphics
- Multilevel lists for clearer documentation in Live Scripts
Performance & Productivity
- Faster scatter plots
- Improved performance of core numerical functions (including log)
- Faster table joins and grouping for large datasets
- Faster MATLAB startup and everyday statistical workflows
These enhancements are part of Core MATLAB
Learn more
If you would like to go deeper into any of the workflows above, we would be happy to schedule an online meeting with you to discuss your specific modeling challenges.


コメント
コメントを残すには、ここ をクリックして MathWorks アカウントにサインインするか新しい MathWorks アカウントを作成します。