The R2026a release is now available, and I’ve selected a few highlights to keep you up to date on the most important graphics and app building features. This release introduces a new way to publish interactive graphics to the web and collaborate on apps using MATLAB Drive, along with a new chart for exploring data distributions, updates to the axes toolbar, and extensions to existing features that may not already be on your radar. R2026a also improves graphics stability and memory usage, enabling more visualizations from large data sets than in previous releases.
See the release notes for a complete list.
Share Interactive Graphics on the Web with Web Canvas
|
Have you ever wanted to zoom in, pan, or rotate an exported MATLAB plot displayed on a webpage? Now you can! R2026a introduces web canvases that preserve the interactivity of MATLAB graphics beyond the desktop. You can create HTML files directly from MATLAB plots and live scripts, with the axes remaining interactive for panning, zooming, and rotating within the HTML file. The exported files open in any modern web browser without requiring a MATLAB license, making it easy to share interactive results with collaborators or host visualizations on a web server.
More info: Display Interactive Graphics on Webpages
|
Share Apps Directly from App Designer with MATLAB Drive
 |
Collaborative app building became significantly easier in R2026a. If your app is stored in MATLAB Drive, you can now share it directly from App Designer without leaving the design environment. From the Designer tab, you can invite collaborators with view or edit permissions, or create a shareable link that others can use to run or download the app. This makes it easier to review, iterate, and collaborate on apps with teammates while keeping access management closely tied to your development workflow.
More info: Share App in MATLAB Drive
|
A More Accessible and Flexible Axes Toolbar
 |
The axes toolbar has a makeover in R2026a, with a more accessible and consistent interface. The toolbar now appears persistently above axes and can be expanded or collapsed interactively and programmatically. It supports keyboard navigation, works well with touch and screen readers, provides options for toolbar location, and supports SVG images for sharper icons.
More info: Stay tuned next week for a detailed article on the new axes toolbar. See also Axes Toolbar Properties
|
Visualize Distributions with raincloudplot
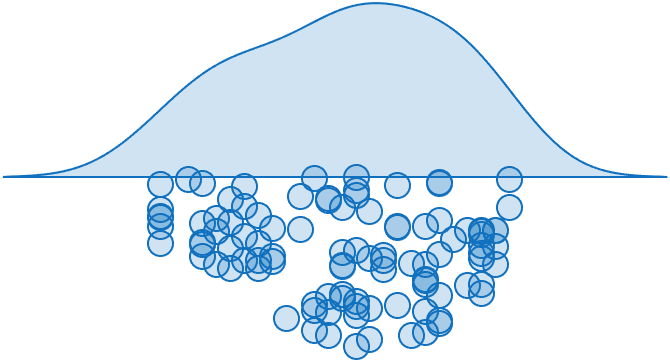 |
The new raincloudplot function combines the strengths of violinplot and swarmchart into a single visualization. A smooth kernel density estimate conveys the overall distribution, while individual data points remain visible for added context. The function supports matrices and grouping variables, making it well suited for exploratory analysis and comparisons across groups.
More info: raincloudplot, Violin Plot blog article
|
Plot Directly from Table Data
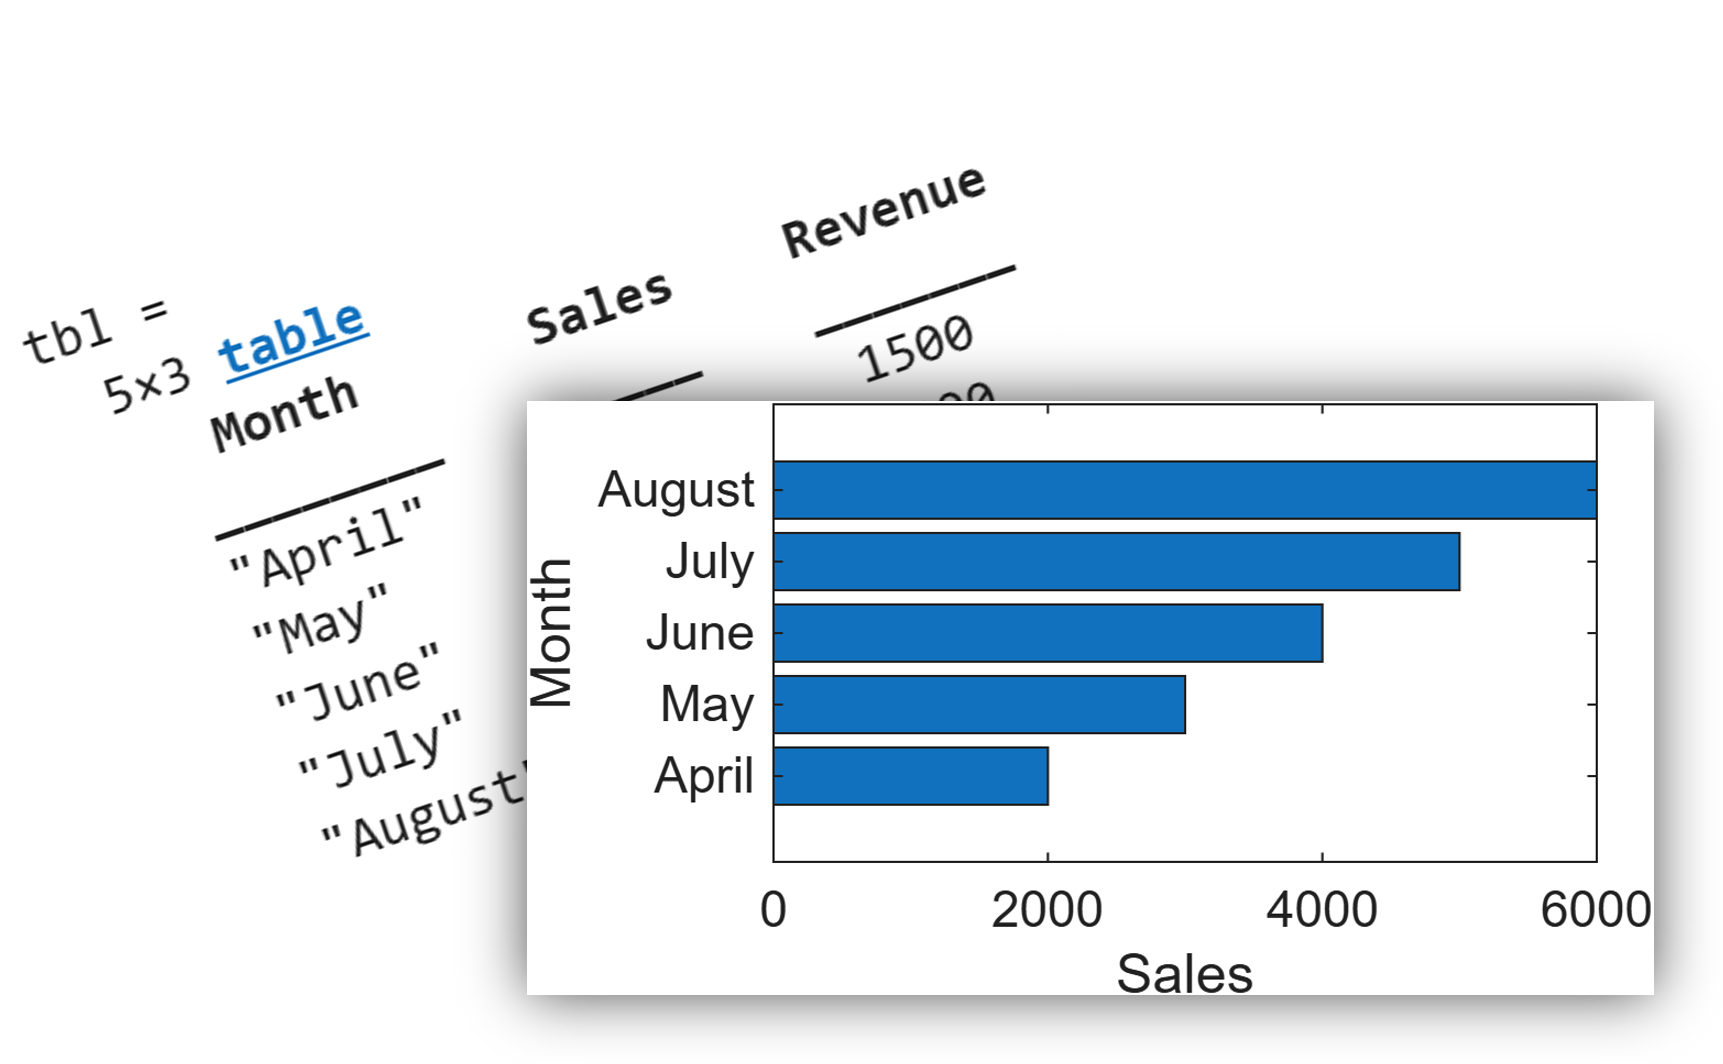 |
Charting support for table-based workflows continues expansion in R2026a. Functions including bar, barh, area, histogram, polarhistogram, geodensityplot, and binscatter now accept table and timetable inputs directly. When table syntax is used, axis labels and legends automatically use table variable names when appropriate, simplifying code and improving readability.
More info: Plots That Support Tables
|
Increased flexibility when Linking Axes
|
Multiple calls to linkaxes now preserve previously established links instead of replacing them. This makes it easier to build coordinated interactions such as linking x-axes across one pair of axes and y-axes across another, similar to the behavior of scatterhistogram, without losing either association.
More info: linkaxes
|
These are a few of my favorites, but don’t take my word for it. R2026a includes a wide range of additional updates across graphics and app building that may be exactly what you’re looking for. I encourage you to check out the
release notes for the full list of changes and details. As always, we’d love to hear your thoughts in the comments below.


Comments
To leave a comment, please click here to sign in to your MathWorks Account or create a new one.