
MATLAB Kalman Filtering for ThingSpeak Sensor Data!?
I was just reading our doc page on Kalman Filtering in MATLAB. This gave me an idea. Could I apply this to ThingSpeak IoT data? And, if so, why?
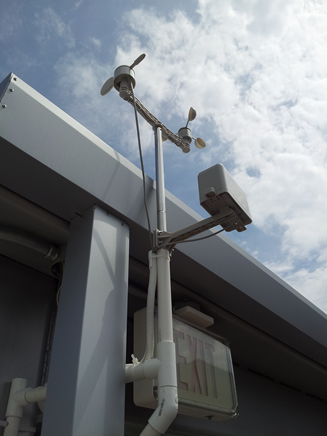
Turns out we have a weather station at the MathWorks Apple Hill building. This weather station has been producing data for 10 years on ThingSpeak Channel 12397.
A Kalman filter is a classic method for estimating the true value of something you can only measure noisily. It keeps a running best estimate and updates it with each new reading, blending what it expected with what the sensor reported and leaning on whichever it trusts more. It can also track things you never measured directly, like how fast a value is changing. Noisy readings go in; a cleaner signal, and its trend, come out.
To give this a try in MATLAB, you can use the thingSpeakRead function and pass in the channel number. The pressure sensor data is a good example of the type of sensor data suited for a Kalman Filter. Pressure changes slowly and smoothly. Barometric pressure drifts over hours, it does not jump around, so the filter’s core assumption, that the value moves at a roughly steady rate between readings, holds up well. The sensor’s noise is right on the scale of the real changes. Our station reports pressure in steps of 0.01 inches of mercury, and the hour-to-hour movement is often about that same size, so the raw signal comes through as a jagged little staircase, exactly the kind of noise a Kalman filter is built to smooth away.
So, why Kalman? For me, the thing I care about with pressure is the trend. Falling pressure means weather is on the way, rising pressure means it is clearing. You cannot read that reliably off a jumpy line, but the filter estimates the rate of change directly and clearly shows you the trend.
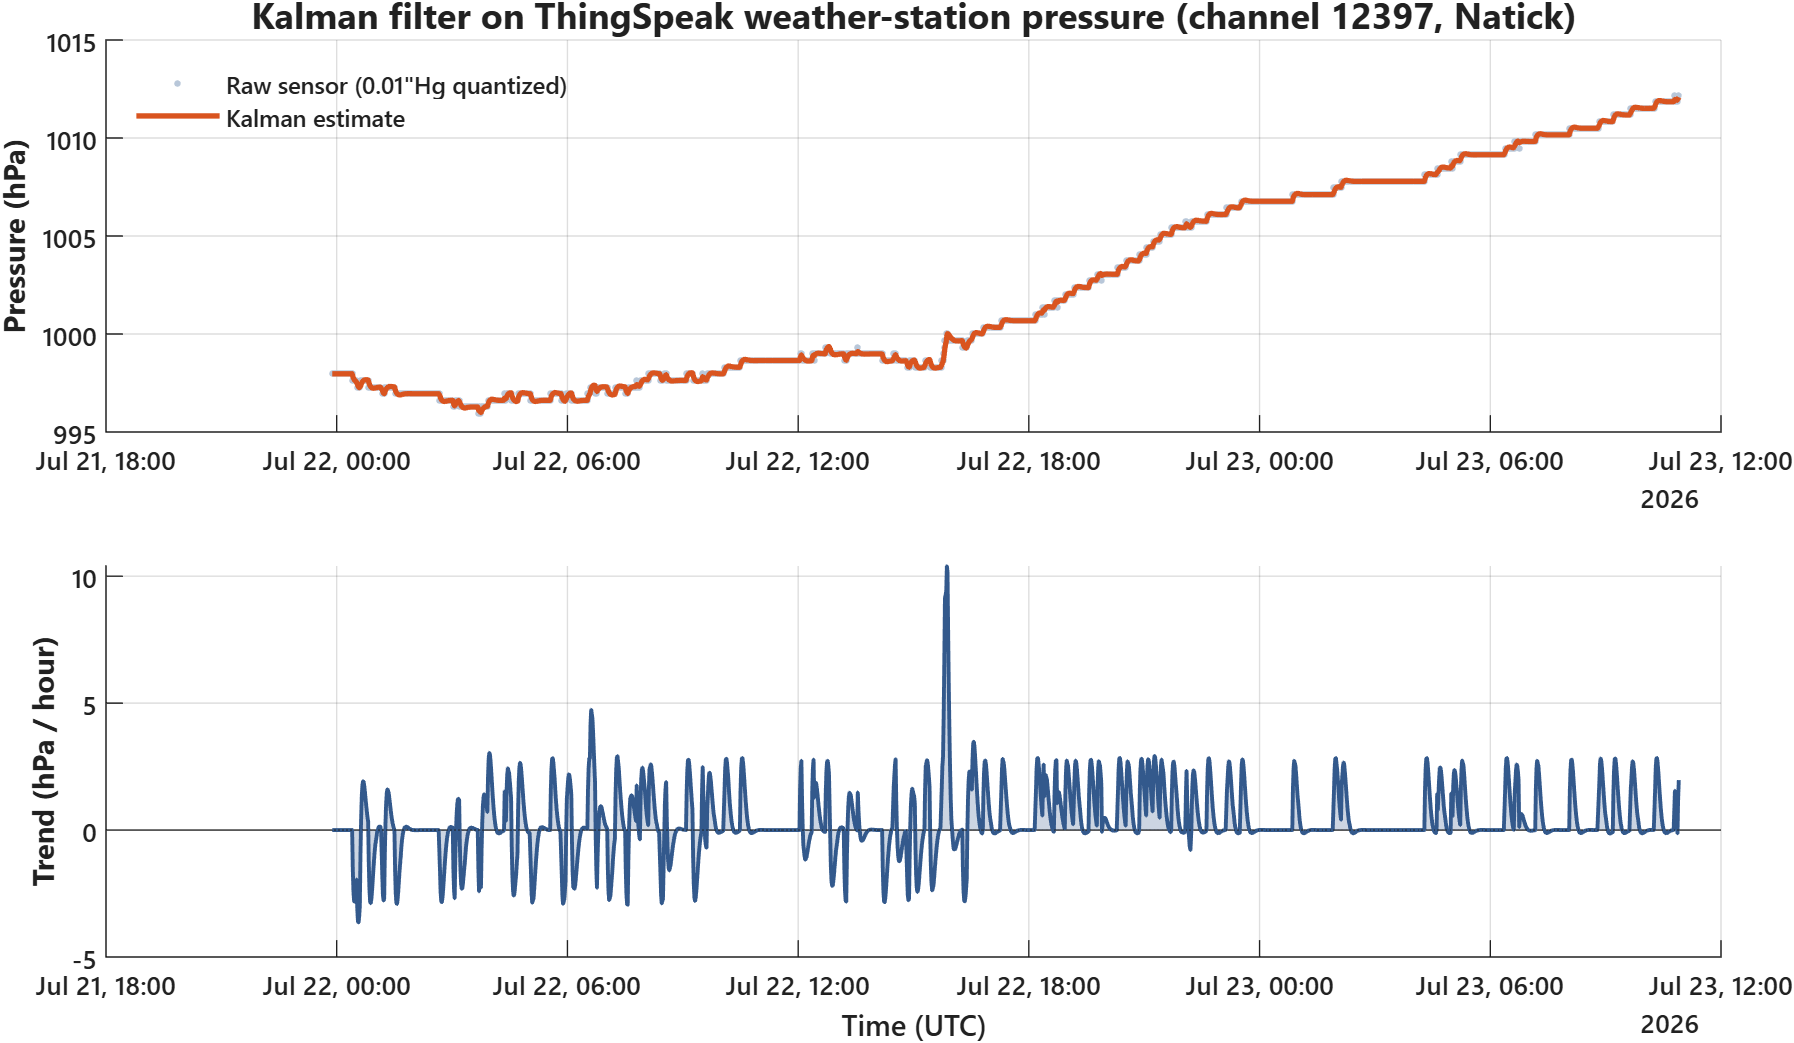
Reading the trend, I can see the pressure is going up. It might be counterintuitive, but this doesn’t mean it’s going to rain in New England like yesterday. A climbing barometer is a sign of high pressure moving in, which usually means clearing skies and fair weather. The overnight dip to 996 hPa was the unsettled part; the steady rise that followed is the atmosphere settling down. The filter helped us understand what’s going on… a little bit more. It is worth noting that pressure is only one clue in weather forecasting. And I am not a meteorologist.
Over to you… what else can you find deep in the MATLAB documentation and apply to IoT sensor data?





Comments
To leave a comment, please click here to sign in to your MathWorks Account or create a new one.