
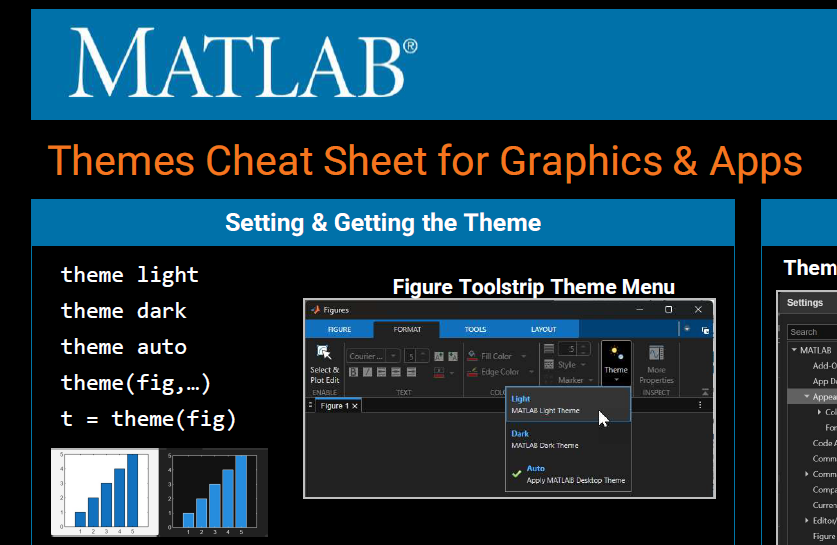
The long-awaited dark theme is now available in MATLAB R2025a. This article serves as a guide for designing charts and apps in a specific theme or that adapt automatically to either theme. By... read more >>

The long-awaited dark theme is now available in MATLAB R2025a. This article serves as a guide for designing charts and apps in a specific theme or that adapt automatically to either theme. By... read more >>

Guest Writer: Abby Skofield
We're excited to welcome Abby Skofield back to the blog! Abby has been at the forefront of bringing dark mode to MATLAB graphics and apps, and today she’s sharing... read more >>
Guest Writer: Travis Roderick
Travis joined MathWorks in 2013, bringing experience from previous roles in software development across the healthcare, finance, and storage network industries. He... read more >>
Guest Writer: Brian Knolhoff
Brian is a software engineer on the Figure Infrastructure and Services team at MathWorks. After first encountering MATLAB while calibrating radar systems, he now... read more >>
Guest Writer: Chris Portal
Chris Portal serves as director of engineering for the MATLAB graphics and app building teams, delivering data visualizations, app building capabilities, and data... read more >>
Guest Writer: Benjamin Kraus Ben has been a Software Engineer on the MATLAB Graphics and Charting Team since 2015. Although his first exposure to MATLAB was in 2000 as an undergraduate... read more >>
Guest Writer: Abby Skofield We're excited to welcome Abby Skofield back to the blog! Abby revisits the classic topic of "Making Pretty Graphs"—this time bringing a modern twist with some of... read more >>
Guest Writer: Eric Ludlam Joining us again is Eric Ludlam, development manager of the MATLAB charting team. Discover more about Eric on our contributors page. In the previous... read more >>

Guest Writer: Eric Ludlam Joining us again is Eric Ludlam, development manager of the MATLAB charting team. Discover more about Eric on our contributors page. MATLAB Graphics... read more >>

Guest Writer: Baldvin Einarsson Baldvin is a software engineer in the Statistics and Machine Learning Toolbox. His journey with MATLAB began in the early 2000s during his college years... read more >>
These postings are the author's and don't necessarily represent the opinions of MathWorks.