Polygon Interpolation
I recently answered a question on MATLAB Answers about how patch interpolates color data. This is a question I get a lot because it's a bit more complicated than you might expect. Let's take a close look at what it can and can't do.
First we'll need a patch with FaceColor='interp'. I'll start with this simple polygon and use the X coordinate as the color data.
ang = 0:pi/4.5:6;
x = cos(ang);
y = sin(ang);
c = x;
patch('XData',x,'YData',y,'CData',c,'FaceColor','interp')
colorbar
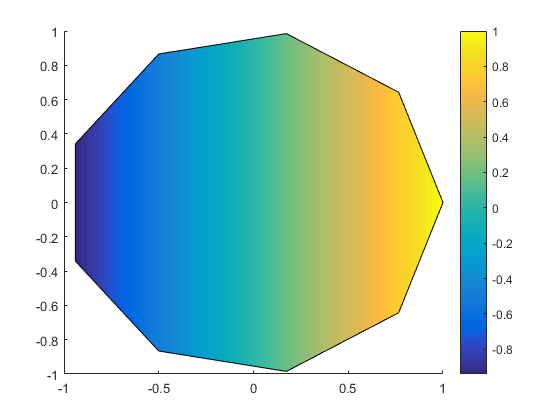
That’s simple, isn’t it? We can work out what color each pixel should be by inserting the X coordinate into the colormap. But the Patch object is actually doing something a little subtler here. It’s actually creating a set of triangles which subdivide the interior of the polygon and then handing those off to the graphics system and asking it to figure out the color of each pixel in each of the triangles. The graphics system does that using linear interpolation. That works in this case, because the function that generates the colors is linear, and it can be exactly represented by linear interpolation across a set of triangles.
But if the color data can't be represented as a linear function, then we’re going to see some artifacts.
Consider what happens if we make the color values the square of the X coordinates.
cla
c = x.^2;
patch('XData',x,'YData',y,'CData',c,'FaceColor','interp')
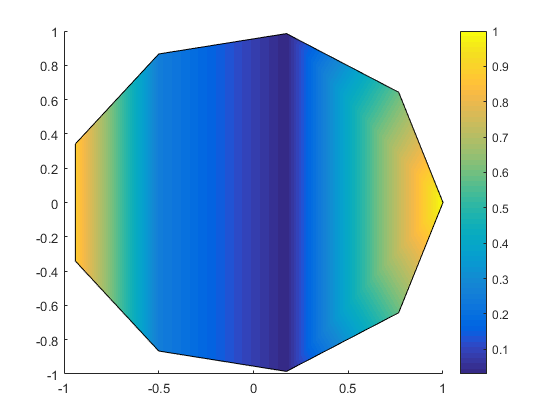
That looks pretty good, but if you look closely, you'll see some glitches. For example, the dark blue is to the right of the 0. That seems strange, doesn't it? We can see other issues if we switch to a busier colormap.
colormap(lines(7))
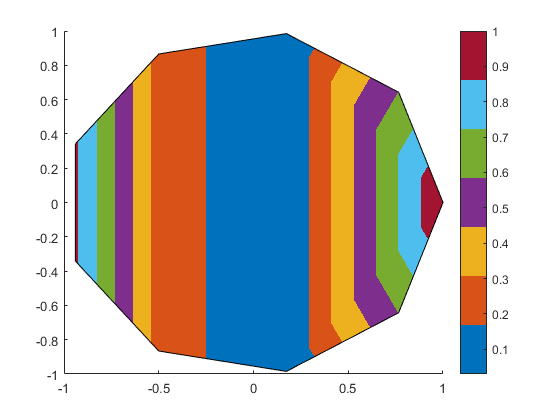
Because we're using X for the colors, those lines should all be vertical. They shouldn't have those bends on the right side.
What you're seeing is that patch has created 7 triangles to cover the interior of the polygon. Near those "glitches", there are two little triangles and one big triangle which are each doing linear interpolation between the point on the right and the points at the top and bottom. But the two small triangles can "see" the points at X=0.766, while the big triangle does't "see" those points. Because the color values at those points don't lie on a linear function through the other 3 points, the small triangles perform a different interpolation from the large one.
There is no set of 7 triangles which is going to be able to get you the “right” colors in this case. The only way to do this correctly is to subdivide the interior of the polygon until your elements are small enough that a linear approximation is good enough. The patch object doesn't know how to do this automatically.
Of course that's an awfully simple polygon. What happens if we use something more complex?
cla
x = [1 2 2 3 3 1 1 4 4 1];
y = [1.5 1.5 3 3 1 1 0 0 4 4];
c = x;
patch('XData',x,'YData',y,'CData',c,'FaceColor','interp')
xlim([.5 4.5])
ylim([-.5 4.5])
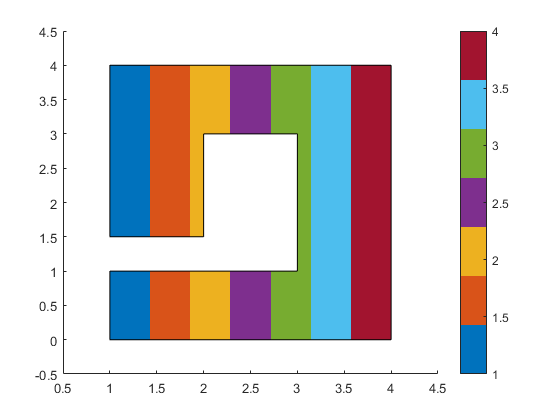
That still looks good when we're using the X coordinates as the color data. And it actually works fine for any linear combination of the X & Y coordinates.
cla
c = x + y;
patch('XData',x,'YData',y,'CData',c,'FaceColor','interp')
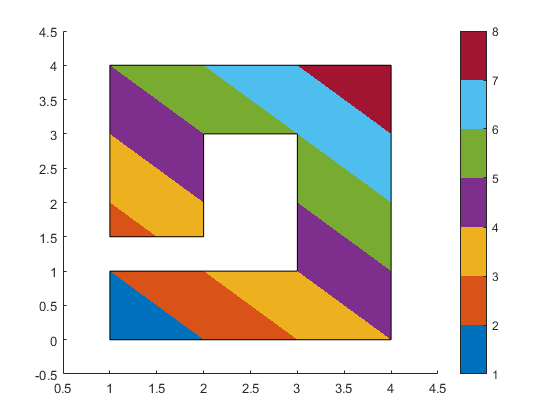
But as we've seen, it doesn't work for color data which follows a non-linear function.
cla
c = cos(x) .* cos(y);
caxis auto
patch('XData',x,'YData',y,'CData',c,'FaceColor','interp')
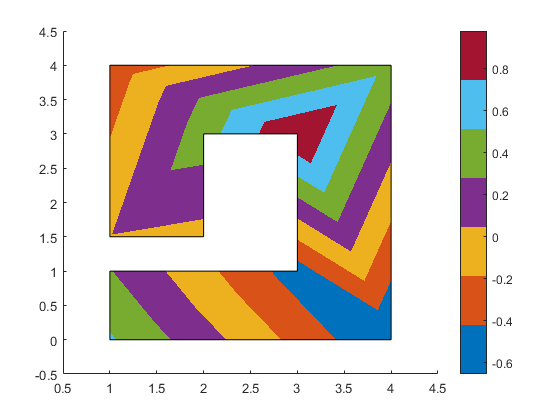
As I said earlier, to handle this case well, we will need to divide the polygon in many small facets, rather than 7 large triangles. We call this operation "meshing".
There are a couple of ways to do this. Here's one of the simpler ones. First we use meshgrid to create a fine mesh of quadrilaterals that covers the original polygon.
[x2, y2] = meshgrid(linspace(min(x),max(x),25), linspace(min(y),max(y),25));
Next we use inpolygon to create a mask of the points in the mesh which are outside of the polygon.
mask = ~inpolygon(x2,y2,x,y);
Now we create our color array from the high-res coordinates, and put nans in all of the locations which are outside the polygon.
c = cos(x2) .* cos(y2);
c(mask) = nan;
Then we can use surf2patch to convert this mesh of quads into a form that patch can handle.
fv = surf2patch(x2,y2,zeros(size(c)),c);
Finally we create our patch.
patch(fv,'FaceColor','interp','EdgeColor','none')
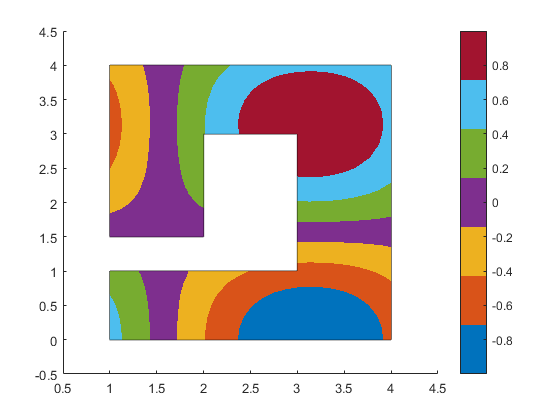
That has divided the polygon into a bunch of little quadrilaterals, as we can see here:
set(findobj(gca,'Type','patch'),'EdgeColor',[.75 .75 .75])
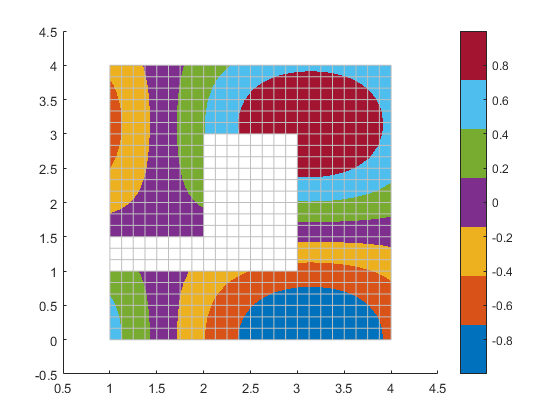
That works for this polygon because it is all 90 degree corners, but it isn't going to work for the more general case. One option which is more flexible is to use something like delaunayTriangulation, as Damian Sheehy explained in this post on Loren's blog.
But if you have the Partial Differential Equation Toolbox then there's another way to do it. That toolbox comes with good meshing tools because creating a mesh that accurately represents a non-linear function is very important when you're solving partial differential equations.
I'm not going to go into how you do this in any great detail, but creating a good triangle mesh looks something like this. First we need to setup a 2D PDE model.
pdem = createpde(2);
Next we give it our geometry. Its format for representing geometry is a little different from the patch object.
geom = [2; 10; x'; y'];
gd = decsg(geom);
geometryFromEdges(pdem,gd);
And now we can call generateMesh to perform the meshing. The Hmax argument to generateMesh controls how finely our polygon gets subdivided.
mesh = generateMesh(pdem,'Hmax',.2);
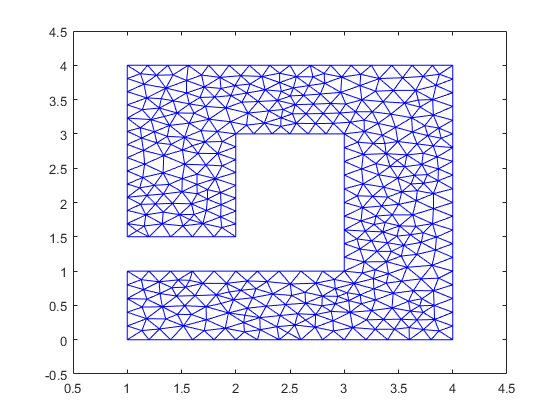
The resulting mesh is a set of triangles which cover the interior of the polygon. We can see them using triplot.
triplot(mesh.Elements',mesh.Nodes(1,:)',mesh.Nodes(2,:)')
xlim([.5 4.5])
ylim([-.5 4.5])
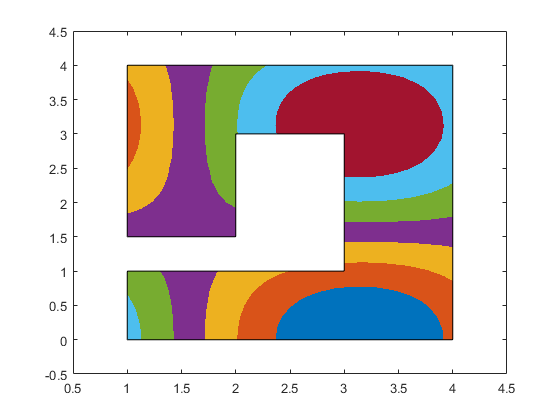
Now that we have a mesh, we can use that to create the patch that we wanted.
cla
c = cos(mesh.Nodes(1,:)) .* cos(mesh.Nodes(2,:));
patch('Faces',mesh.Elements','Vertices',mesh.Nodes','FaceVertexCData',c', ...
      'FaceColor','interp','EdgeColor','none')
patch('XData',x,'YData',y,'FaceColor','none')
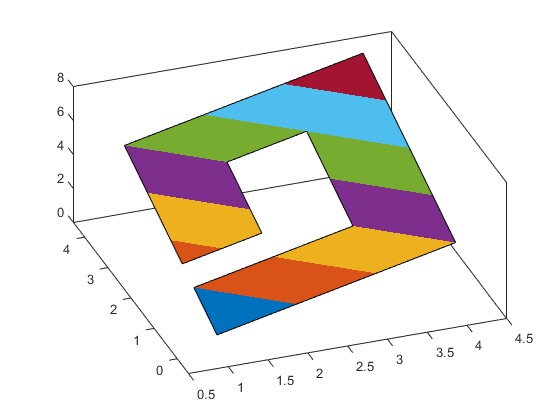
So that's how patch interpolates color data. Coordinate data is actually handled exactly the same way. If I make the Z coordinate a linear function of the X and Y coordinates, then complex polygons are drawn correctly.
cla
c = x + y;
z = c;
patch('XData',x,'YData',y,'ZData',z,'CData',c,'FaceColor','interp')
view([-20 50])
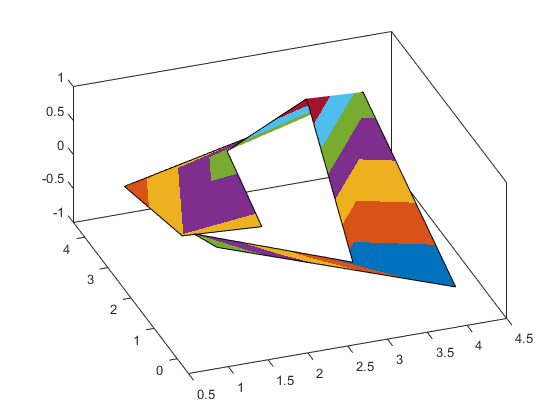
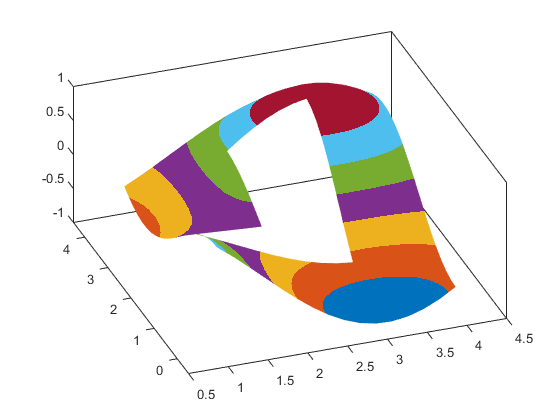
But if the Z coordinates are not a linear combination of the X & Y coordinates, then the results get pretty messy.
cla
c = cos(x) .* cos(y);
z = c;
patch('XData',x,'YData',y,'ZData',z,'CData',c,'FaceColor','interp')
view([-20 50])
But the same meshing approaches we used for color data work for geometric data.
cla
c = cos(mesh.Nodes(1,:)) .* cos(mesh.Nodes(2,:));
z = c;
patch('Faces',mesh.Elements','Vertices',[mesh.Nodes', c'],'FaceVertexCData',c','FaceColor','interp','EdgeColor','none')
view([-20 50])
I hope that gives you a good idea of what patch can and can't do for interpolating data across a polygon, and also some idea of where to turn when patch can't do what you need.
- Category:
- Rendering


