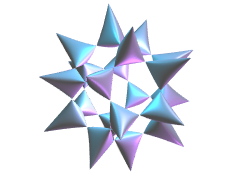
Implicit Surface IntersectionsWe talked about implicit surfaces here back in March. Recently, there was an interesting question about them on MATLAB Answers.Dr. Vyas has a surface which is defined by... 更多内容 >>
Note
Mike on MATLAB Graphics has been archived and will not be updated.

Implicit Surface IntersectionsWe talked about implicit surfaces here back in March. Recently, there was an interesting question about them on MATLAB Answers.Dr. Vyas has a surface which is defined by... 更多内容 >>

GraphicsSmoothing and AlignVertexCentersIn R2014b we introduced a new property on the figure named GraphicsSmoothing. When this is set to on, all of the graphics drawn into that figure are drawn... 更多内容 >>

Stacked Bar3MATLAB's bar3 command is kind of cool, but what if we have a 3D matrix like this?rng(0) array = randi(10,[4 5 3]); It might be nice to create something that was sort of a stacked... 更多内容 >>

Object Creation PerformanceBack in January, we looked at the performance of creating a graphics object with a lot of data. Today we're going to look at what is basically the opposite problem. What... 更多内容 >>

Patch WorkBack before the internet, programmers collected xeroxed copies of old notes and papers. We traded these with our friends and coworkers, like samizdat. I still have a large filing cabinet... 更多内容 >>

If you live in the US, you probably filed your taxes sometime in the last couple of months. If you're like me, that got you looking at data about taxes. One nice source of tax data is the US Census... 更多内容 >>

The Keeling... 更多内容 >>

But I think that my favorite Turing paper is one he wrote after the war called The Chemical Basis of Morphogenesis. It describes an idea he had for how all of the different patterns on the skins of various animals are formed. It's really a very simple idea. You have two chemicals which are distributed nonuniformly through the skin of the animal. They react with each other, and they each diffuse from areas with high concentrations to areas with low concentrations. It turns out that fiddling the reaction rates and the diffusion rates can yield all sorts of different patterns which look very similar to patterns you see in nature.... 更多内容 >>

Implicit Curves and SurfacesIn some earlier posts ( part1, part2) we explored how to draw parametric curves using MATLAB Graphics. Now lets turn our attention to implicit curves.We know that the... 更多内容 >>

Last time we looked at how the performance of MATLAB's graphics system scales with the number of data points. Another interesting lens to look at performance scaling with is the way that performance... 更多内容 >>
这些文章由作者发布,不一定代表 MathWorks 的意见。