Top 10 “Behind the Headlines” stories of 2017
Science and technology played a major role in many of 2017’s biggest stories. The Behind the Headlines blog covered many of these by explaining how MATLAB and Simulink were behind the scenes, helping engineers, scientists, and researchers innovate around the world. Here are our top ten stories of the year, based which posts our MATLAB users and STEM audiences read the most.
10. Apple renews interest in biometrics: Here’s an algorithm for facial recognition and more
Facial recognition algorithms start our list of top ten posts for the year. It’s no surprise when you consider some of the high-profile data breaches that have come to light during 2017, from the stolen data of all 3 billion Yahoo users to the Equifax breach.
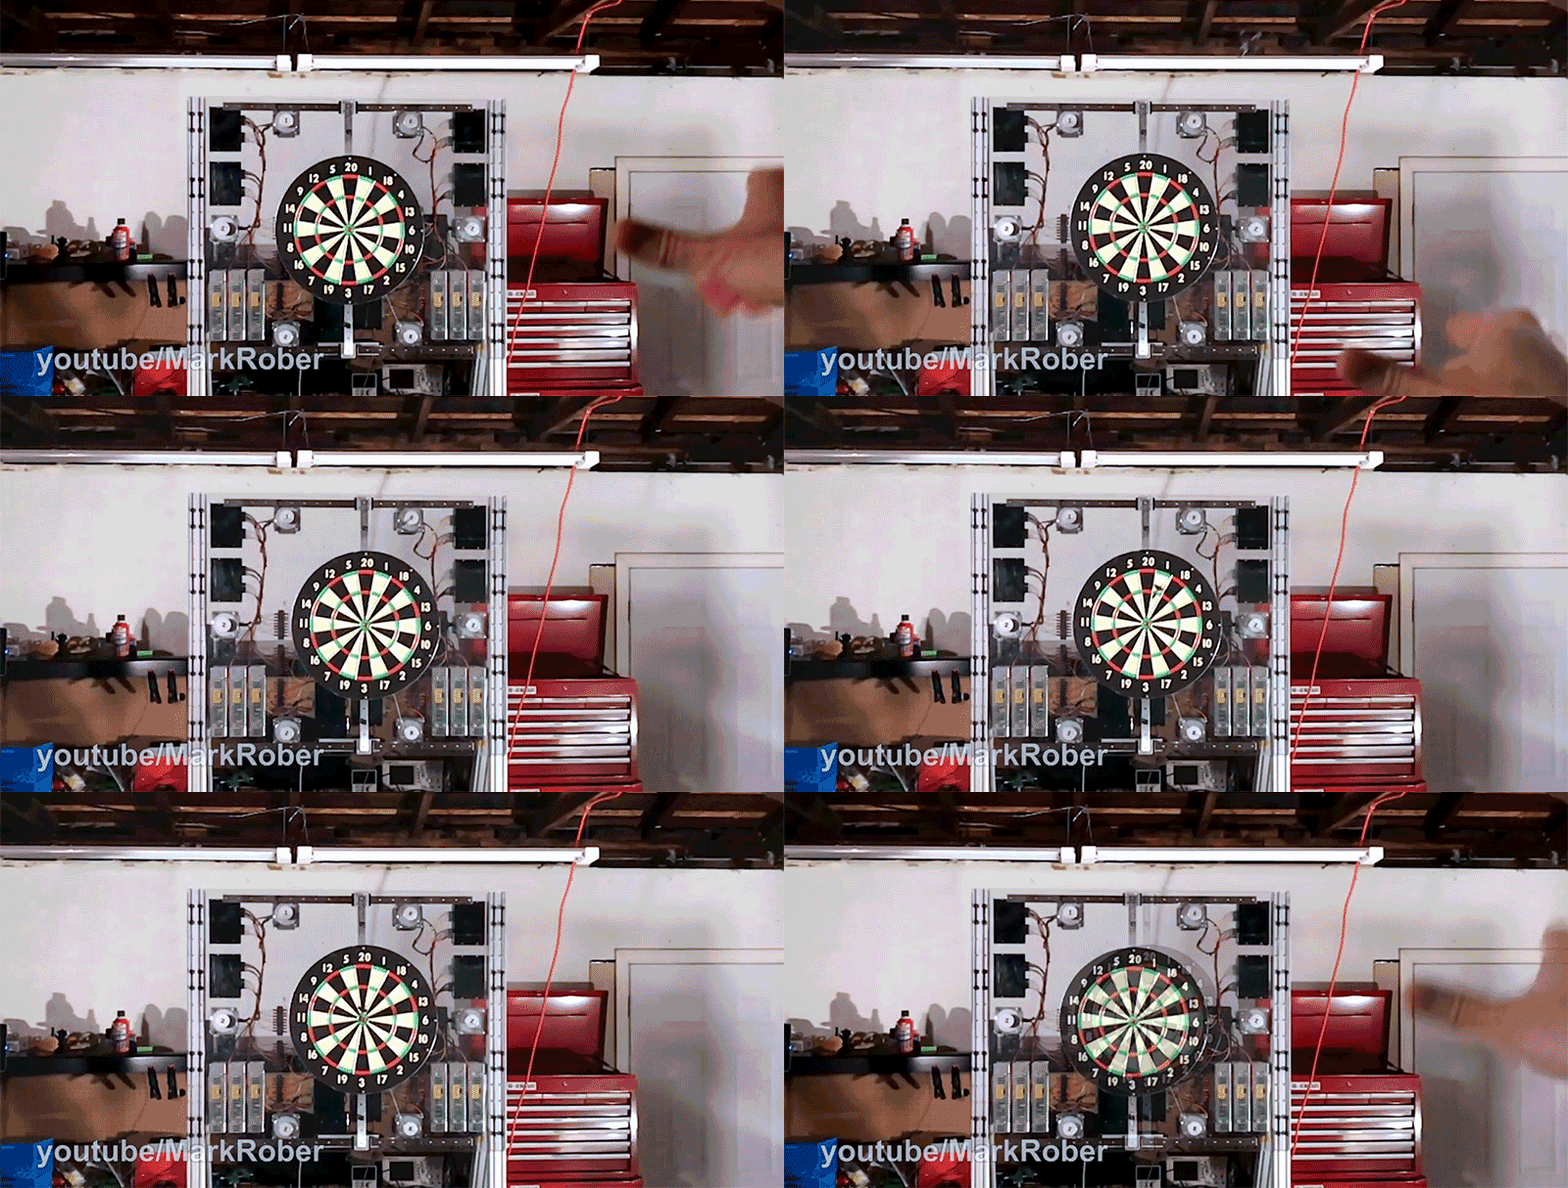
9. Maker hits a bullseye with a cool robotic dartboard
The post in the number nine spot was a fantastically fun maker project. What do you get when a former NASA engineer combines motion tracking infrared cameras, 6 stepper motors, fishing line, and a dartboard? A dartboard that moves to intercept the dart and gives you a bullseye every time.
8. MATLAB helps revive The Beatles only live album
The eighth most popular post of 2017 describes how Abbey Road Studios used audio processing techniques to filter the fans screams out of the one and only live concert recording by The Beatles. The Live at the Hollywood Bowl album and featured songs from their performances at the Hollywood Bowl in 1964 and 1965.

Image credit: This photo was published in the Aug. 24, 1964 Los Angeles Times. John Malmin/LA Times via Getty Images.
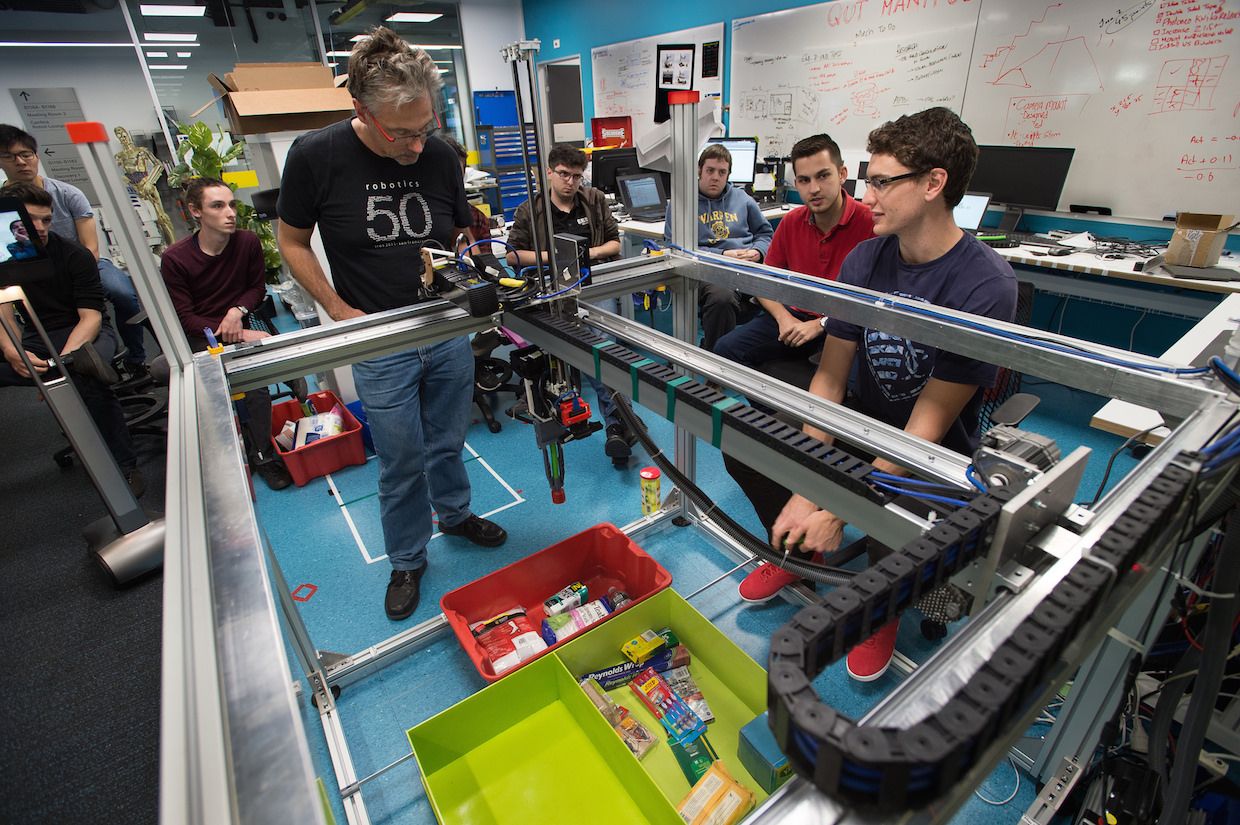
7. A unique robot takes home big prize in the Amazon Robotics Challenge
This post detailed how the Australian Centre for Robotic Vision took home the championship, and $80,000 in prize money, from the 2017 Amazon Robotics Challenge. Their robot, a Cartesian coordinate robot aptly named Cartman, used computer vision, image processing, and deep learning to identify the objects it needed to “pick and place” in the packing contest.
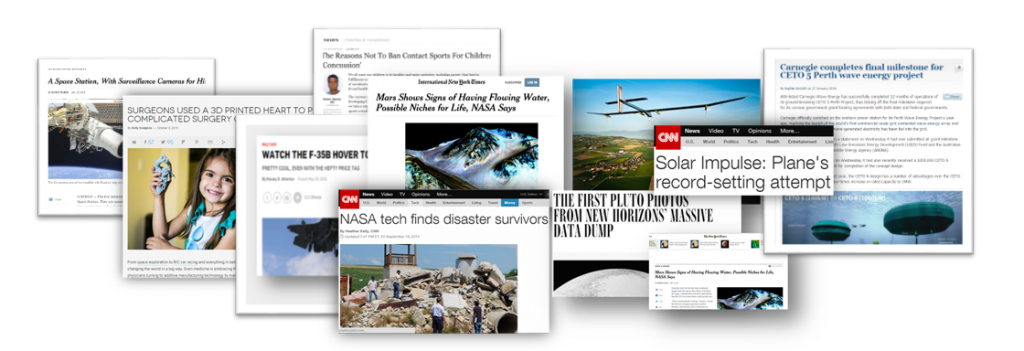
6. NASA’s new technology paralyzes drones that enter restricted areas
NASA’s drone defender system called Safeguard garnered the number six spot on our 2017 list. Safeguard disables a drone if it fails to respond to a warning and enters a designated no-fly zone.
Image Credit: NASA
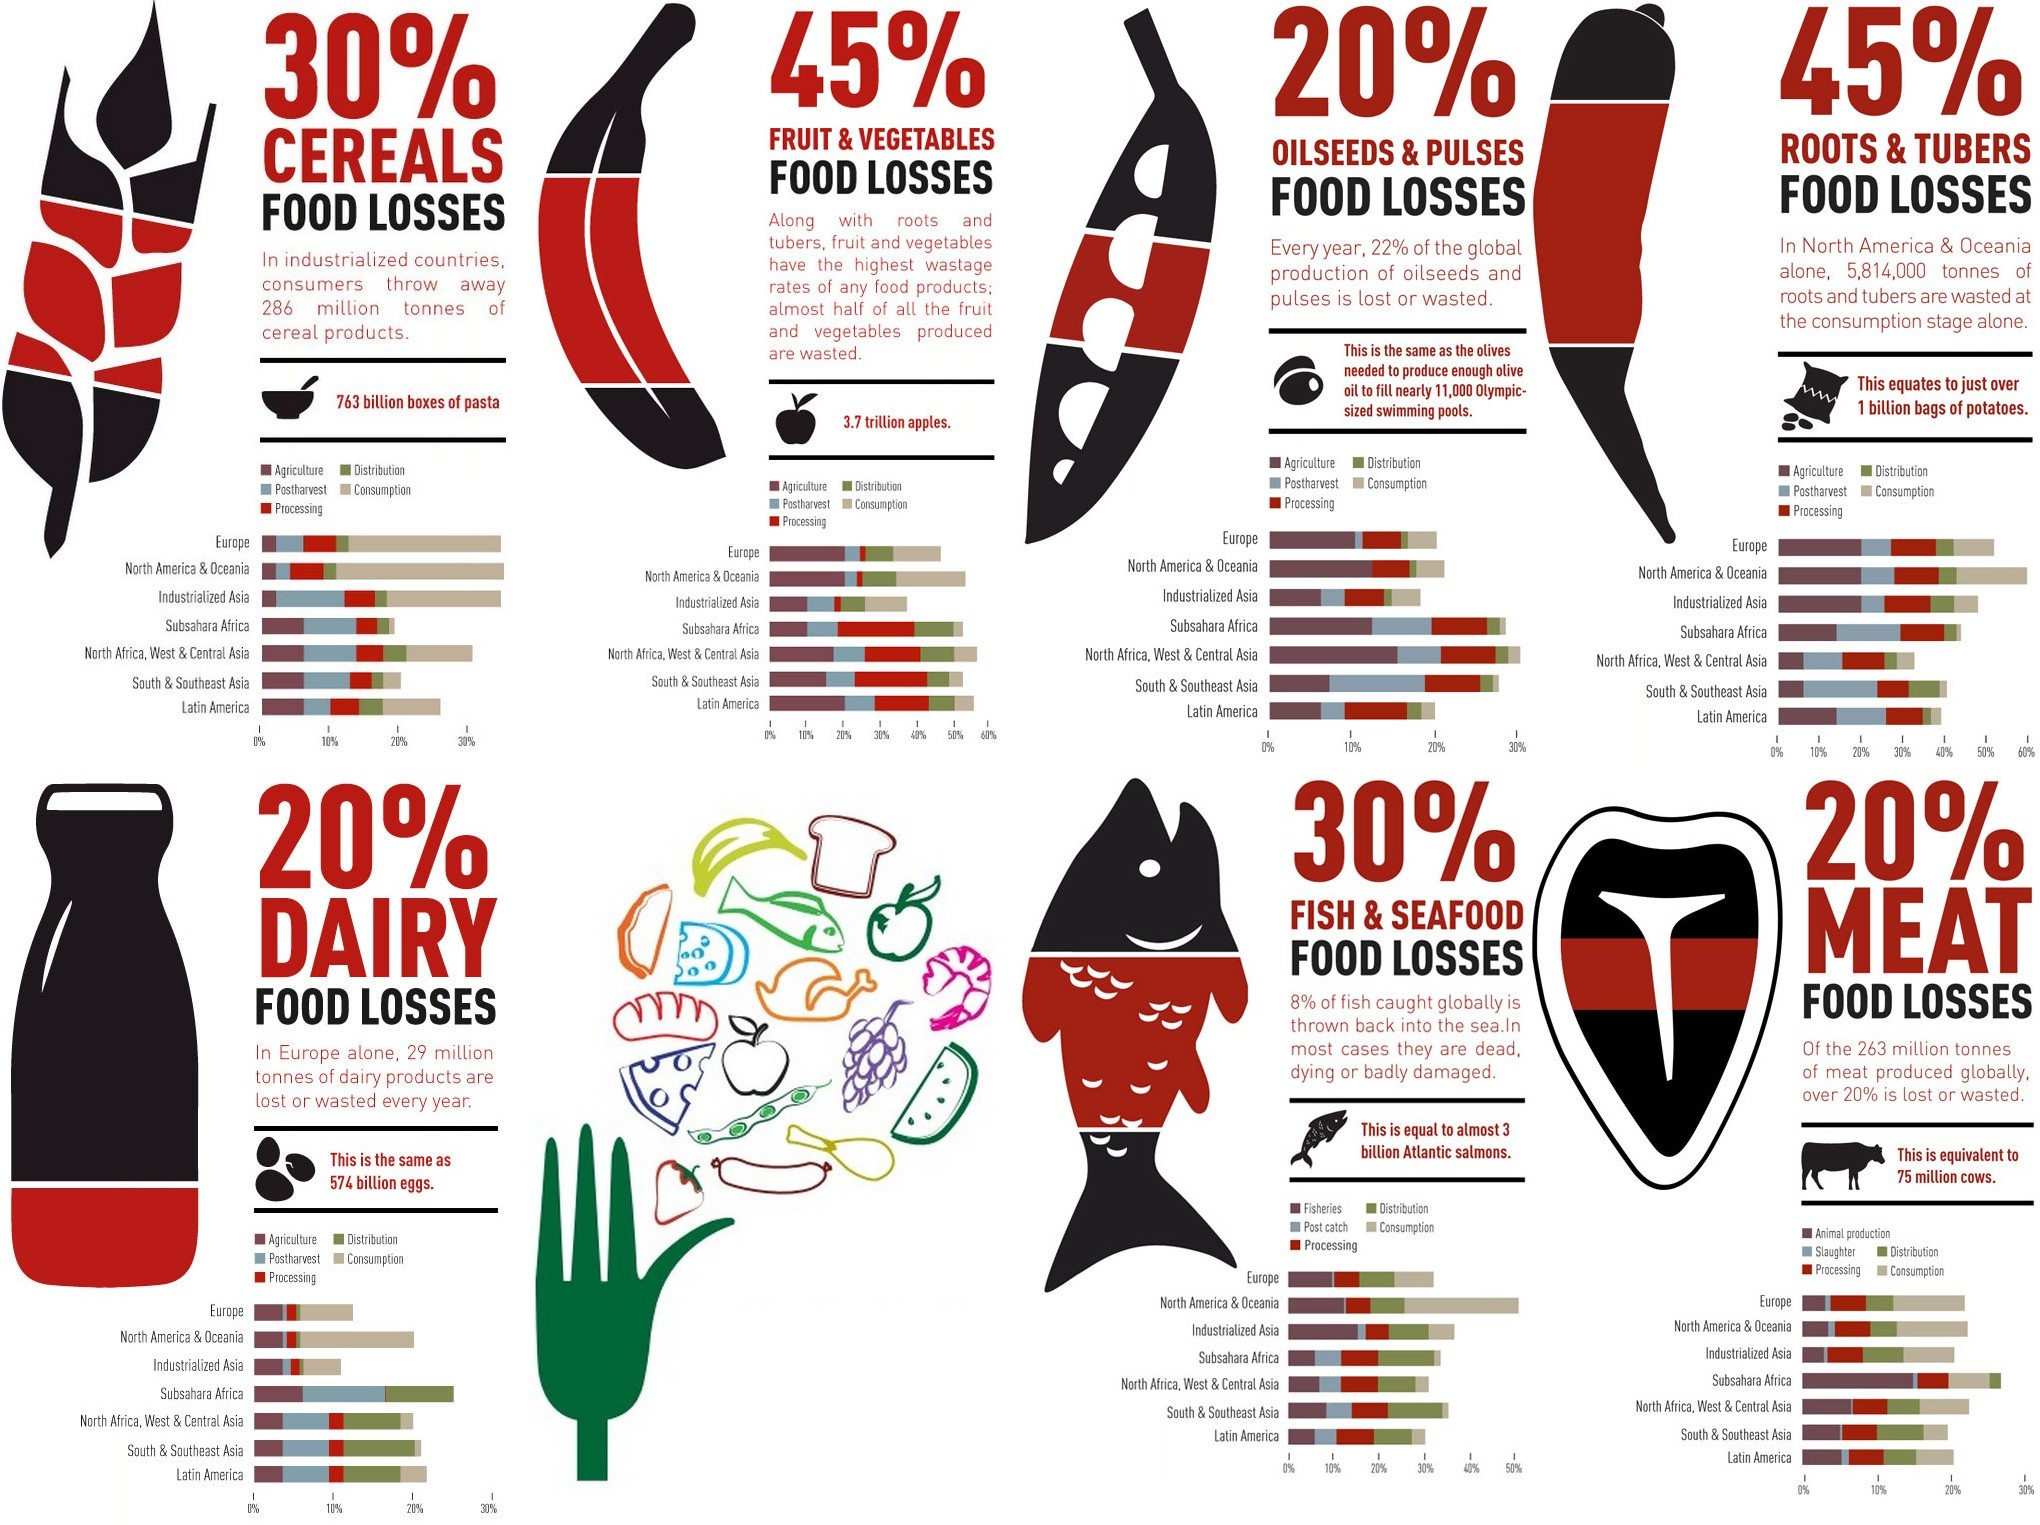
5. Using data analytics to reduce food waste
The fifth most popular post for 2017 looks at how one major retailer, Tesco, is using a data-driven approach to improve operations and reduce food waste.
4. Using machine learning to build a better battery
In many ways, 2016 was the year of the exploding battery. So, at the beginning of 2017, we looked at how machine learning was being used to design a better battery.
3. Researchers use image processing to study Usain Bolt’s stride. Does scoliosis make him faster?
Like number seven above, the third most popular post for 2017 also used image processing techniques. This time, they were used to analyze the stride of the world-class sprinter, Usain Bolt.
2. This robot learns by reading your mind
The second most popular post for 2017 originated from a collaboration between MIT’s Computer Science and Artificial Intelligence Laboratory (CSAIL) and Boston University. The team designed a system that combines neuroscience and machine learning to create a mind-reading robot. Seriously. This robot can read your mind.
1. Data Visualization shows the global temperature change since 1850
Climate change dominated much of the news for 2017, with renewed arguments on both the effects of climate change and the politics of environmental protection.
Not surprising, the most read post of 2017 focused on climate change. The post showed how data scientists are creating new ways to show how the global temperature has changed over the past century and a half.


コメント
コメントを残すには、ここ をクリックして MathWorks アカウントにサインインするか新しい MathWorks アカウントを作成します。