Spatial transformations: Translation confusion
The last time I wrote about spatial transformations, I explained that imtransform uses the function findbounds to locate the transformed image in output space. By default, imtransform computes an output image grid that is just big enough to capture the output image, wherever it is located.
We designed imtransform this way because we thought it was what users would expect most of the time. Generally, this default behavior works out just fine. The big exception, though, is when users call imtransform to apply a pure translation. Let's try it and see.
I = imread('pout.tif');
imshow(I)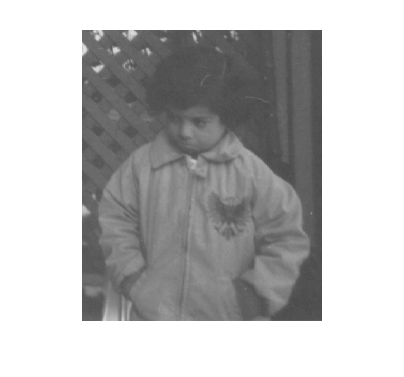
Now make an affine tform struct representing a pure translation:
T = [1 0 0; 0 1 0; 50 100 1];
tform = maketform('affine', T);
Apply the translation:
I2 = imtransform(I, tform);
And compare the two images:
subplot(1,2,1)
imshow(I)
title('original image')

subplot(1,2,2)
imshow(I2)
title('translated image')
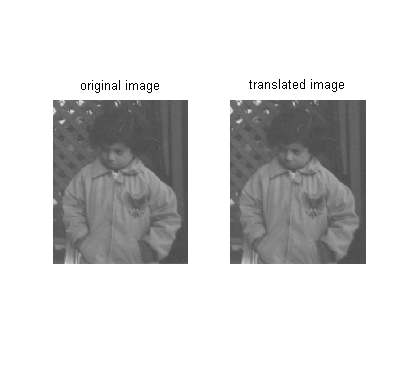
They're the same! Hence, the confusion.
Here imtransform has been a little "smarter" than users want. By automatically adjusting the output-space grid to capture the output image wherever it moves, the translation gets removed.
There are a couple of things you can do to make this work better. First, you can ask imtransform to give you more information about the output space coordinates of the output image, and then you can use this information when displaying the image. Here's how that might work:
[I2,xdata,ydata] = imtransform(I,tform);
xdata is a two-element vector specifying where the first and last columns of I2 are located in output space. Similarly, ydata specifies where the first and last rows are located. You can pass this information along to the display function, imshow.
subplot(1,2,1)
imshow(I)
axis on
axis([0 400 0 400])

subplot(1,2,2)
imshow(I2,'XData',xdata,'YData',ydata)
axis on
axis([0 400 0 400])
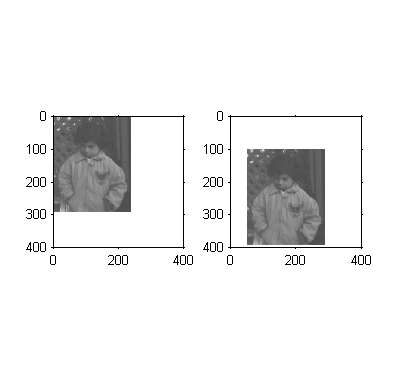
A second technique is to tell imtransform what output-space rectangle to use.
I3 = imtransform(I,tform,'XData',[1 290],'YData',[1 391]);
clf
imshow(I3)
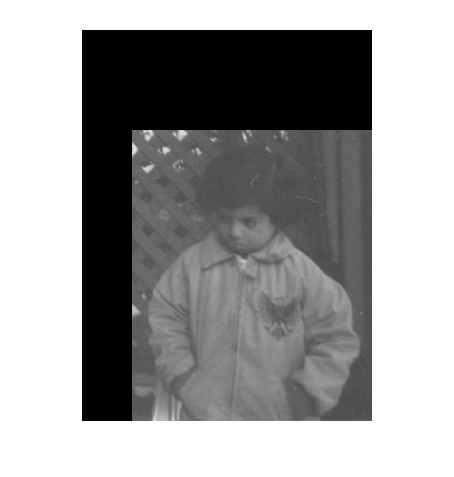
If you understand the XData and YData parameters, you can use these techniques separately or in combination to implement whatever translation effect you'd like.
Since translation is a regular source of calls to tech support, we are exploring ways to alleviate the confusion. If you have suggestions, please leave a blog comment. Thanks!
 Cleve’s Corner: Cleve Moler on Mathematics and Computing
 The MATLAB Blog
 Guy on Simulink
 MATLAB Community
 Artificial Intelligence
 Developer Zone
 Stuart’s MATLAB Videos
 Behind the Headlines
 File Exchange Pick of the Week
 Hans on IoT
 Student Lounge
 MATLAB ユーザーコミュニティー
 Startups, Accelerators, & Entrepreneurs
 Autonomous Systems
 Quantitative Finance
 MATLAB Graphics and App Building




评论
要发表评论,请点击 此处 登录到您的 MathWorks 帐户或创建一个新帐户。