Extracting dot locations from a graphic
I was looking at the image below on a web page recently and I decided to extract the locations of all the dots. I thought the procedure might make a nice little end-of-the-week how-to post.
% Did you know that imread can read directly from a URL?
url = 'http://cgm.cs.mcgill.ca/~godfried/teaching/projects97/belair/example1.gif';
[X, map] = imread(url);
imshow(X, map)

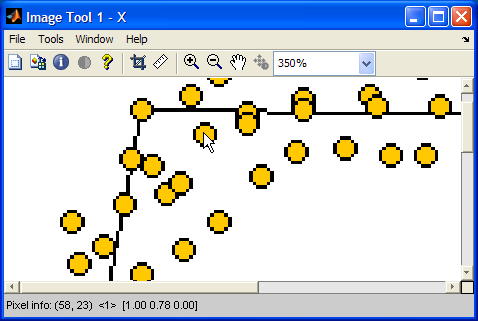
First question to answer: What is the index of the color used for the dots? One easy way to go is to use imtool.
Here's a screenshot:

As you can see, when I placed the mouse pointer over the center of one of the dots, the pixel info display at the lower left showed that the index value was 1, and the corresponding colormap color was [1.00, 0.78, 0.00].
Now that we know the index value, we can easily make a binary image of just the interior of the dots.
bw = X == 1;
imshow(bw)

Now we can compute the centroids of the dots.
s = regionprops(bw, 'Centroid')
s =

122x1 struct array with fields:
    Centroid
The line above is a new syntax for regionprops that we introduced earlier this year in R2009a. Previously, you always had to compute a label matrix first using bwlabel and then pass that label matrix to regionprops. Now regionprops can do this computation directly on the binary image. Since the label matrix is not computed, this new syntax uses less memory and usually runs faster than the old version.
For those of you using an older version, do this instead:
 L = bwlabel(bw);
 s = regionprops(L, 'Centroid');
To show the results, display the image and then superimpose the centroid locations.
imshow(X, map)
hold on
for k = 1:numel(s)
    centroid_k = s(k).Centroid;
    plot(centroid_k(1), centroid_k(2), 'b.');
end
hold off

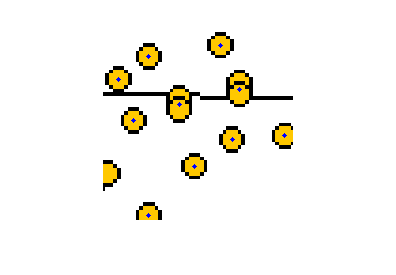
Hmm. It looks we got only one dot at some of those locations. Use the zoom button on the Figure Window toolbar to zoom in. Or you can do it noninteractively:
axis([50 100 0 50])

Yep. For overlapping circles, we are only getting one location. The reason is that the interiors of the overlapping circles are 8-connected to each other, so they are regarded by regionprops as single regions. To get two locations for these overlapping circles, we have to label the regions using 4-connectivity instead of 8-connectivity.
To do this we have to compute the connected components in a separate step and then call regionprops.
cc = bwconncomp(bw, 4);
s = regionprops(cc, 'Centroid');
bwconncomp is also new to R2009a. Users of R2008b and earlier can do:
 L = bwlabel(bw, 4);
 s = regionprops(L, 'Centroid');
imshow(X, map)
hold on
for k = 1:numel(s)
    centroid_k = s(k).Centroid;
    plot(centroid_k(1), centroid_k(2), 'b.');
end
hold off
axis([50 100 0 50])

Much better.
This little example showed several useful things:
- Reading an image directly from a URL
- Using imtool to inspect individual pixel values
- Using the new, more efficient syntax of regionprops
- Using the new bwconncomp
- Superimposing plots on an image
Have a happy weekend!


댓글
댓글을 남기려면 링크 를 클릭하여 MathWorks 계정에 로그인하거나 계정을 새로 만드십시오.