Continuous-time Fourier transform basics
In my planned (well, partially planned) discussion on Fourier transforms, I'll focus on three of the four types I listed in my November 23 post:
- Continuous-time Fourier transform
- Discrete-time Fourier transform
- Discrete Fourier transform
The existence of multiple transform flavors, as well as the details of their relationships, is at the heart of much of the confusion on this topic.
Let's start with the continuous-time Fourier transform. (When the context makes it clear whether I'm talking about the continuous-time or the discrete-time flavor, I'll often just use the term Fourier transform.)
The continuous-time Fourier transform is defined by this pair of equations:


There are various issues of convention and notation in these equations:
- You may see a different letter used for the frequency domain (
 or f, for example). I am in the habit of using
  for the continuous-time Fourier transform and
  for the discrete-time Fourier transform.
- You may see i instead of j used to represent
 . I tend to follow the electrical engineering tradition of using j.
- You may see
 terms appearing in the exponent of e and not in front of the inverse transform integral.
- You may see the signs of the exponent terms switched in the transform equations (that is, the minus sign in the exponent appears in the inverse transform instead of the forward transform).
All these variations exist because we don't already have enough to worry about in the rest of our lives.
With the equations I use, the frequency domain unit is angular frequency (radians/second).
There are so many useful Fourier transform properties and transform pairs that it's hard for to pick the bare minimum necessary for the ideas I want to convey. Today I'll just show you two of the most essential Fourier transform pairs in signal processing applications.
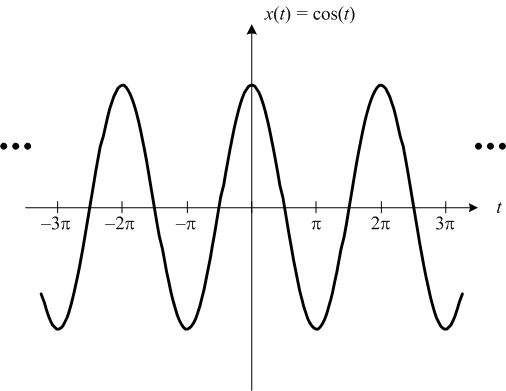
Here's a cosine signal:

Plots corrected December 14 thanks to help from Mark Andrews.
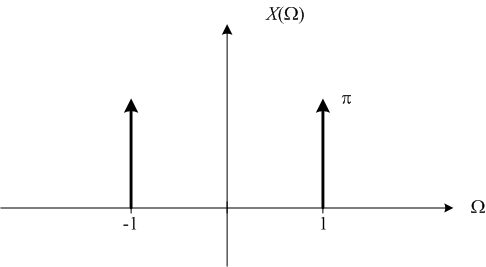
And here is its Fourier transform:

This is what most people who have some knowledge of the Fourier transform expect to see. A signal containing a single frequency (here the frequency is 1 rad/s) has all its frequency domain energy concentrated at that single frequency.
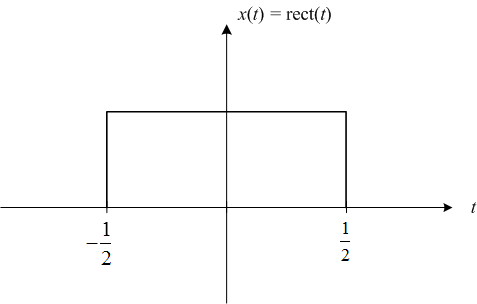
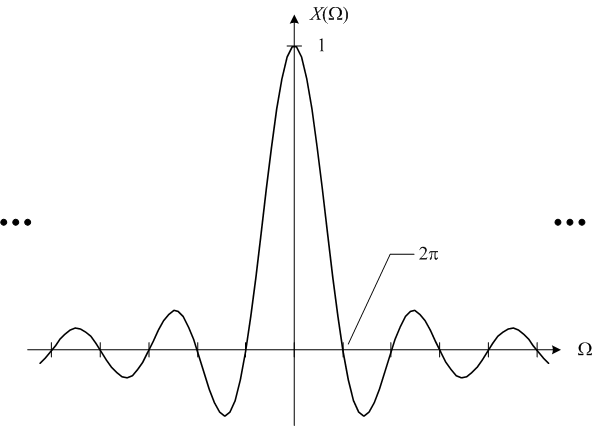
The second pair is a rectangular pulse in the time domain and a sinc function in the frequency domain.


I'd like to call your attention especially to the dots ("...") at the left and right on the cosine and sinc function plots. The dots are there to remind you that these functions have infinite extent. That is, they are nonzero over the entire domain.
That's an important thing to keep in mind. I'll come back to that point next time.
One final note: I've started using the category "Fourier transforms" for posts on this topic. You can see all the related posts by clicking on the category link on the right side of the page.


댓글
댓글을 남기려면 링크 를 클릭하여 MathWorks 계정에 로그인하거나 계정을 새로 만드십시오.