Visualizing regionprops ellipse measurements
The Image Processing Toolbox function regionprops gives you measurements of shape-based measurements of image regions. It's pretty useful, and I have shown many examples of it on this blog. Today I want to show you how to visualize the ellipse-based measurements produced by regionprops.
There are several supported measurements that are based on approximating regions by ellipses:
- Orientation
- MajorAxisLength
- MinorAxisLength
- Eccentricity
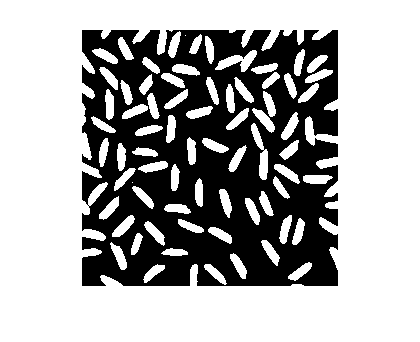
Here's an example.
url = 'https://blogs.mathworks.com/images/steve/2010/rice_binary.png';
bw = imread(url);
imshow(bw)
Call regionprops with the list of measurements you desire:
s = regionprops(bw, 'Orientation', 'MajorAxisLength', ...
    'MinorAxisLength', 'Eccentricity')
s =

99x1 struct array with fields:
    MajorAxisLength
    MinorAxisLength
    Eccentricity
    Orientation
From the output you can infer that regionprops found 99 objects in the binary image. It returned the desired measurements as a 99-element struct array. Here are the measurements for the 10th object:
s(10)
ans =

    MajorAxisLength: 28.7693
    MinorAxisLength: 9.4320
       Eccentricity: 0.9447
        Orientation: -27.0162
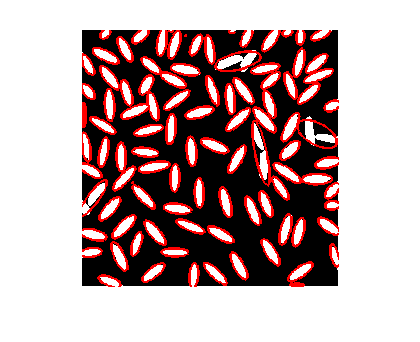
How can you do a visual sanity check of the output? We should probably include some regionprops visualization utilities in the toolbox, but in the meantime I'll show you some code you can use to superimpose the fitted ellipses over the original image.
First, we'll one additional measurement: the centroid.
s = regionprops(bw, 'Orientation', 'MajorAxisLength', ...
    'MinorAxisLength', 'Eccentricity', 'Centroid');
For each ellipse, we'll use a parametric form of the ellipse equation to plot the outline of the ellipse over the image.
imshow(bw)
hold on

phi = linspace(0,2*pi,50);
cosphi = cos(phi);
sinphi = sin(phi);

for k = 1:length(s)
    xbar = s(k).Centroid(1);
    ybar = s(k).Centroid(2);

    a = s(k).MajorAxisLength/2;
    b = s(k).MinorAxisLength/2;

    theta = pi*s(k).Orientation/180;
    R = [ cos(theta)   sin(theta)
         -sin(theta)   cos(theta)];

    xy = [a*cosphi; b*sinphi];
    xy = R*xy;

    x = xy(1,:) + xbar;
    y = xy(2,:) + ybar;

    plot(x,y,'r','LineWidth',2);
end
hold off

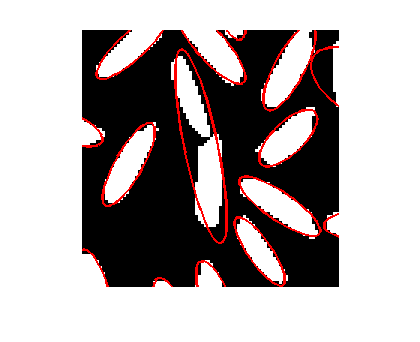
You can zoom in to see exactly why some of the ellipses don't seem to match objects in the image very well. Normally you'd zoom interactively using the zoom controls in the figure toolbar, but of course I can't do that in this blog post, so I'll use the axis function.
axis([140 225 85 170])

Now you can see that the two objects in the center of the display are actually touching at one point. That caused regionprops to consider them to be a single object and to fit an ellipse to both of them together.


评论
要发表评论,请点击 此处 登录到您的 MathWorks 帐户或创建一个新帐户。