Joining us today is Keshav Patel, who is a NSF Graduate Research Fellow at University of Utah. He was a part of the team that finished as runners-up in the 2015 MathWorks Math Modeling Challenge (M3C). Keshav will be following up on a previous blog post regarding Part 1 of the 2019 MathWorks Math Modeling Challenge (M3C). If you have not read part 1 yet, we encourage you to take a look here. Over to you Keshav..
In the first post, Dr. Wesley Hamilton created a framework for how to tackle this problem. Now, let’s take a look at what real participants submitted for this competition. We have combed through several solutions across the entire range of scores to ask, “what makes a good submission?”
In this post, we will be examining teams for their approach to the problem, their assumptions, their results, and their submission structure/format. As you read this blog, you may ask yourself: which of these models is the “best”? We hope to show through these examples the following fact about modeling in the M3C: Model justifications are far more important than the use of high-level mathematics. Good submissions are the ones that have good arguments for their model which provide justification for the choices they made. Said a way that might better appeal to the mathematicians out there:
Cool math + poor communication = bad model
While this blog post is geared towards the M3C, the takeaways from our analysis are good pieces of advice for any math modeling work! If you want to think specifically about how an M3C judge may view your work, It may also be helpful to look at the
M3C Scoring Guide.
Curve Fitting Solutions
A majority of teams approached this problem in a very similar way to Wesley, although the exact methods varied depending on what data they chose to incorporate and what function they chose to fit their data to. First, we will examine a submission that did not win, but came quite close.
A Close Look at a “good” Regression Model
The first team we will be examining set up their submission in a manner outlined by other math modeling resources: they restated the problem, wrote down assumptions, defined their variables, and then described their model. First, let’s take a look at one of the most important components of model setup: the assumptions.
Assumptions
Here are a few of the most noteworthy assumptions in this submission:
- Assumption: The percent of the population that uses vaping products is an accurate measure of the spread of nicotine due to vaping products. Justification: It would be unreasonable to determine the exact amount of nicotine used over the past couple years and predict it for the coming years. Each vaping product has a different amount of nicotine in it and, as seen during our investigation, existing data does not record the amount of nicotine each user consumed against a time metric. However, the spread of nicotine can be measured by its popularity in the US market, as the more people use nicotine-based vaping products, the more nicotine is used.
- Assumption: There is no new pertinent information regarding the dangers of nicotine-based vaping products or laws that will affect its popularity. Justification: Many studies and reports have already been released advocating the negatives of using nicotine-based vaping products, but despite this, as our research showed, the popularity of nicotine-based vaping products has continued to increase. Additionally, although the introduction of comprehensive FDA legislation in the August of 2016 did cause a sharp decrease in the popularity of nicotine-based vaping products [citation], since most relevant legislation regarding the use of nicotine-based vaping products has already been passed, and since these products did regain popularity in the aftermath of the legislation with the surge of vaping use in 2018, it is reasonable to assume that future legislation will not have a significant impact on the popularity of nicotine-based vaping products.
- Assumption: The carrying capacity of the market size for nicotine-based vaping products can be estimated using the historical carrying capacity of the market size for cigarettes. Justification: When analyzing the trends in the popularity of cigarettes, the group noticed that the initial growth in popularity of cigarettes closely mirrored that of nicotine-based vaping products like e-cigarettes.
The first assumption explains to the reader how this team chose to interpret nicotine use data, the second assumption is a simplifying assumption that justifies the extrapolation of their statistical model, and the third assumption gives a justification for using cigarette data to help fill in a missing piece of information for vaping data.
This team not only gave a list of assumptions, but also gave a justification (with citations!) for most assumptions. Some questions your assumptions should help to answer include: how are you interpreting your data? what are you taking into account or not taking into account when you extrapolate your data? why is your choice of function for the regression a valid function to use? What would happen if you did not make the assumption?
One more note about justifications: their first assumption’s justification is more or less an issue of availability of data. Since the competition is only fourteen hours, this is a perfectly reasonable assumption. It would be a good idea to revisit this assumption in the “Strengths and Weaknesses” section of your submission. Consider how your assumptions would change and how you would change your model setup if you had better access to relevant data.
Model
Next, we will look at the model that was built. This team in particular compiled the e-cigarette use dataset in the same way that Wesley did in last week’s blog:
However, they decided to apply a logistic regression to this dataset:
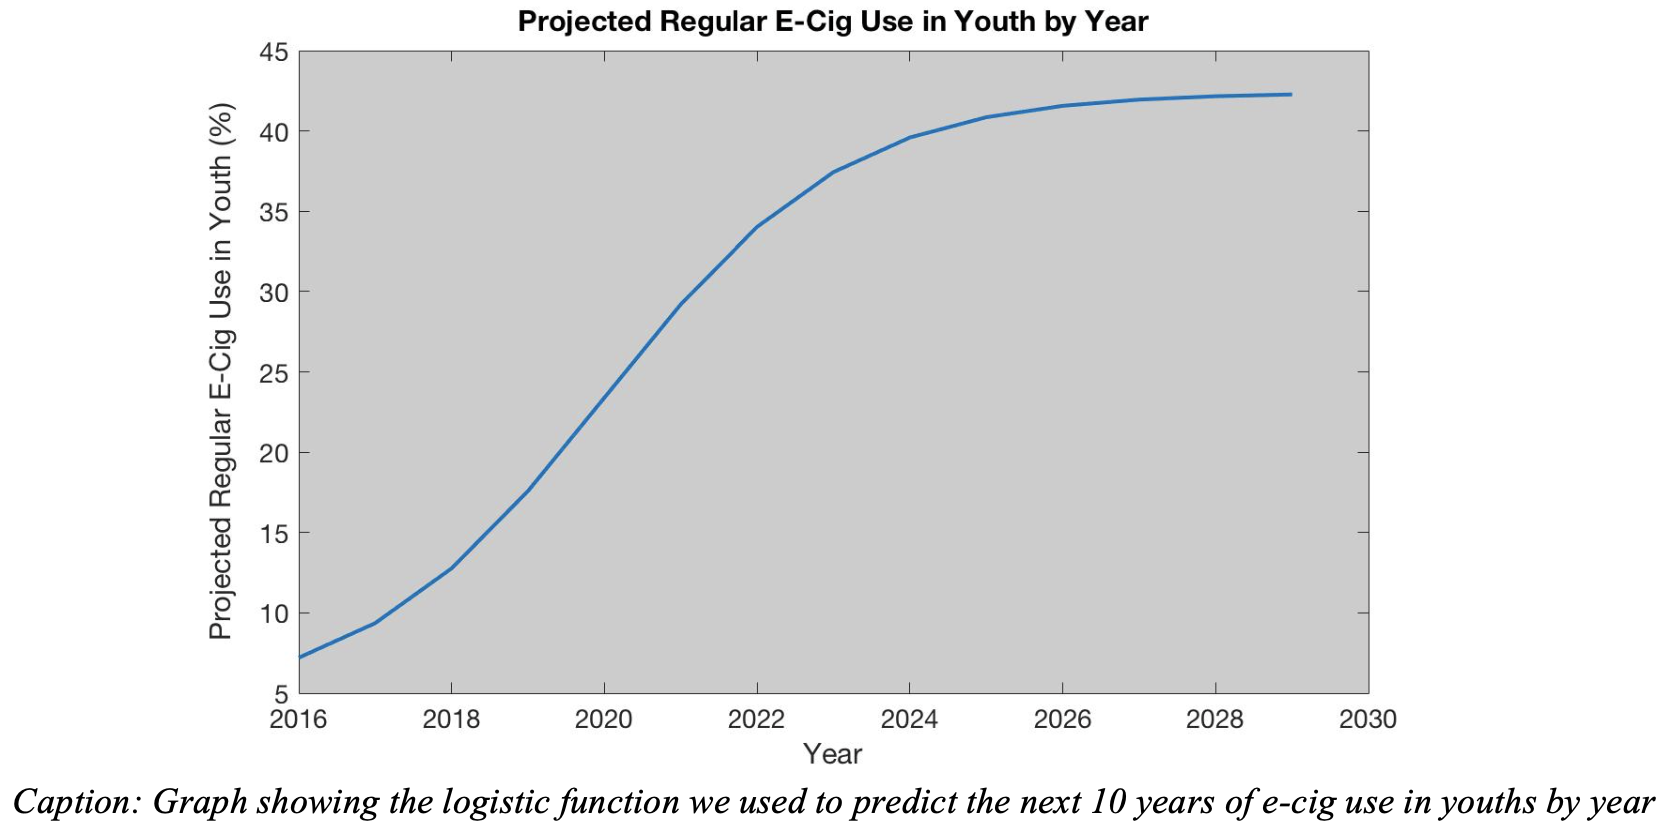
From this curve, they claimed that the overall use of e-cigarettes will increase from about 15% in 2018 to about 45% around the year 2025, and then level off (but never decrease). From a mathematical perspective, this work and their results are perfectly valid. Now is the time we should ask “is this a reasonable result?” Well, one of the team’s assumptions is that “There is no new pertinent information regarding the dangers of nicotine-based vaping products or laws that will that will affect its popularity“. So, unlike the historical data on cigarette usage, there is no change to the laws or how nicotine is consumed to think that the amount of cigarette usage will ever decline. Because I can connect the team’s assumptions to their results, I believe this is a reasonable result. My personal biases would lead me to believe that their result is pessimistic; thankfully, examining the submission based on argumentation helps to take personal biases out the equation.
Before we move on to the Strengths and Weaknesses section, there are two more comments worth making. First, it would have been preferable to plot the logistic curve and the data on the same figure. Second, it is worth taking a moment either in this section or in the Strengths and Weaknesses section to mention the impacts of the results on the real world. After all, math modeling is all about answering real world questions!
Strengths and Weaknesses
Given the time restriction in the M3C, you may have had to make a lot of simplifying assumptions that you otherwise would not have, or you may not have had time to research the topic or data more thoroughly. The Strengths and Weaknesses section is a good time to acknowledge limitations to your model and suggest potential improvements.
In the submission we have been analyzing, the team discussed how their model is an improvement over a polynomial regression because of the physical interpretation. While the team does not go into further details on what “physical interpretation” means, I take it to mean that the polynomial regression concludes that the cigarette usage either becomes negative or increases indefinitely. Neither of these results would be reasonable when thinking about numbers of people, so this is a good thing to make a note of. Wesley also mentioned this fact in Part 1 of our blog series.
The team also conceded that there is a limited amount of data they were able to use, and there was limited benefit to performing a sensitivity analysis. If you are not familiar with sensitivity analysis, check out Chapter 6 of the
Math Modeling Handbook, or sixth installment of our
Essentials of Math Modeling Series.
Their point on sensitivity analysis is one that a judge may push back on. Any parameters that are estimated (by using previous literature, regression, intuition, etc.) are inherently not exact. So, it is usually good practice to analyze how your results would change if your parameters are increased or decreased in some range. For the context of the M3C, a range of 5% or 10% from your estimated value is standard, but in practice, your range may be based on other factors, such as the standard deviation of your estimated value.
As a whole, this team’s submission was not one of the winners, but scored very well. This method of solving the problem was quite popular; the fourth, fifth, and sixth place teams also fit a logistic regression. You can find their submissions
here.
Extra Practice
These questions ask you to compare and contrast the answers you gave to the problems in last week’s blog post to the submission we just looked at and the fourth, fifth, and sixth place submissions, which you can find
here. Note: the fifth place team starts out with an Ordinary Differential Equation (ODE) model, but through some calculations they find a logistic curve that matches their data.
- What similarities and differences do you note in the assumptions? If you had opposing assumptions to another team, consider a) how well you justified your assumption, b) how your model would have to change if you used a different assumption, and c) which assumption you would rather use.
- What similarities and differences do you note in the figures? How does the formatting look (i.e. is the text big enough, are the different curves clearly labeled, is there spacing between table entries, etc.)? If you looked only at a team’s figures and tables (and their captions), could you understand the team’s results?
- Consider each team’s model. Is it clear what they are trying to do? Are the variables clearly marked or labeled in some way? Is there an aspect of their model or their results that go against the team’s assumptions?
Examining Other Regression Models
As mentioned earlier, several teams used a regression approach to tackle this problem. However, there are a few similarities that many non-winning submissions share:
- Poor communication of their assumptions and variables
- Poor summary of the mathematical model
- Poor formatting or placement of important components
Notice that none of these have anything to do with the actual mathematics! Recall our handy-dandy formula as you write your submission and analyze others:
Cool math + poor communication = bad model
Let’s look at some examples of regression models that had some communication shortcomings.
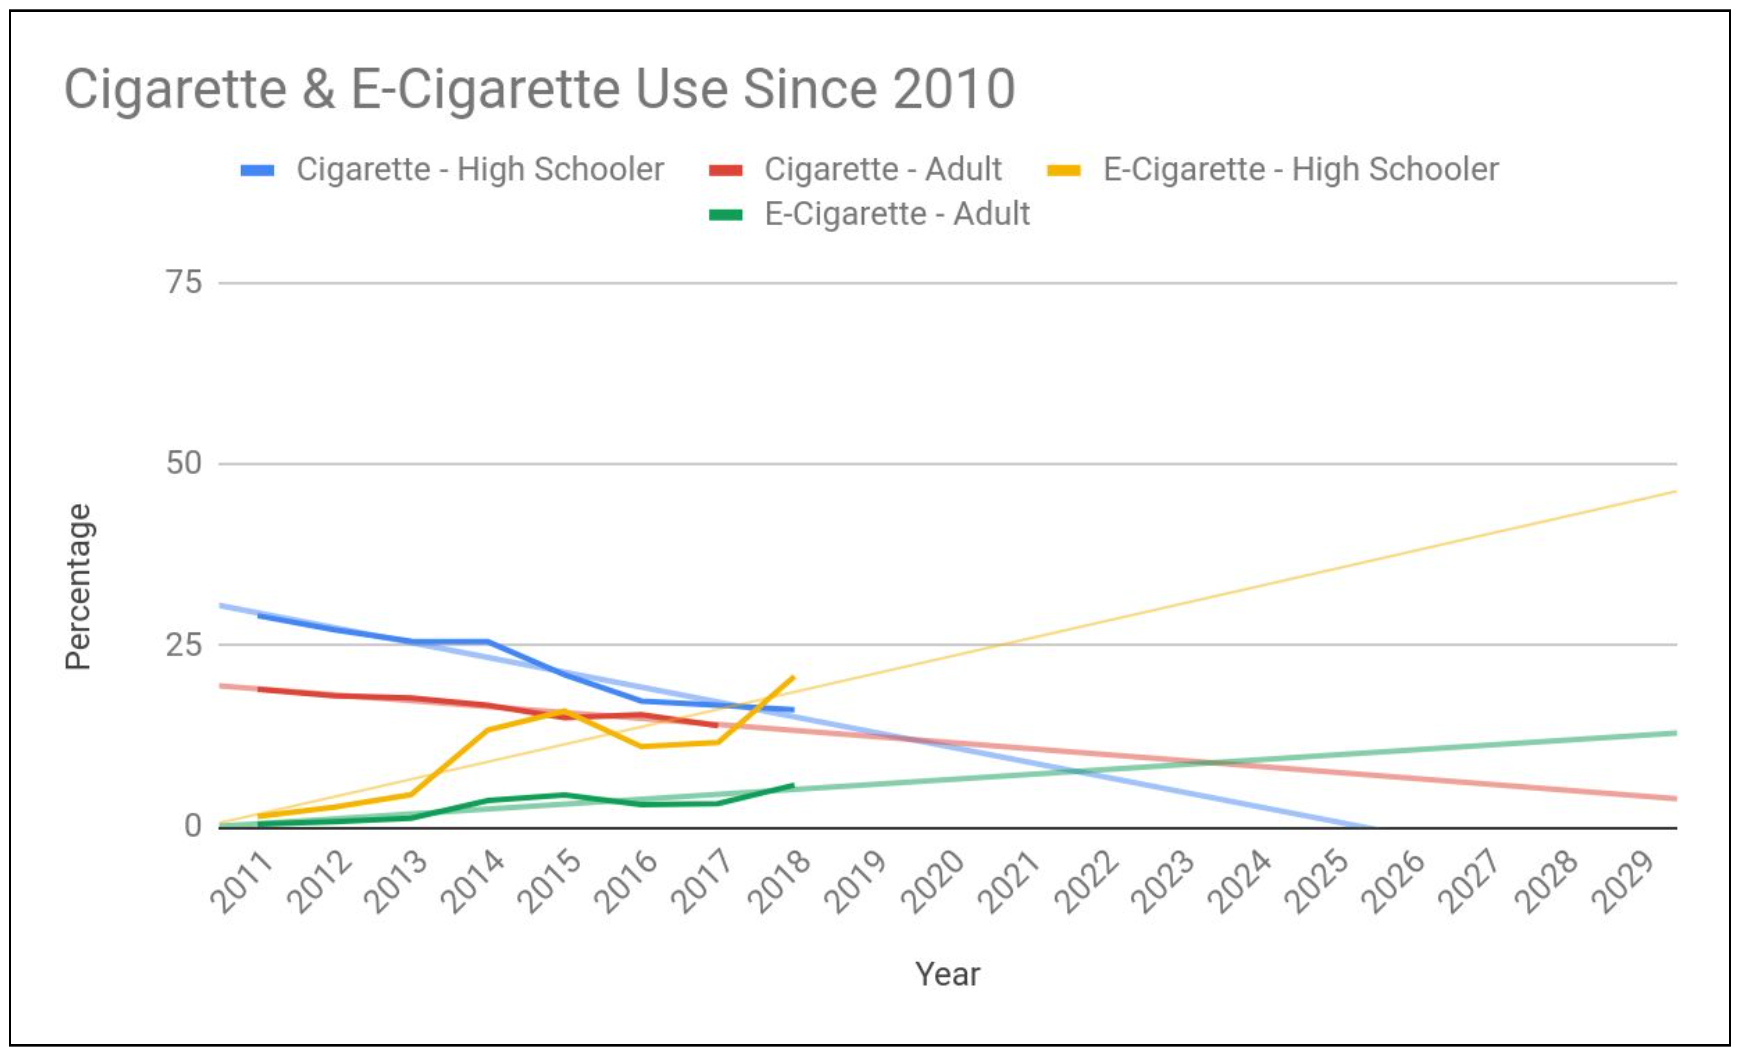
In the first example, this team conducted a linear regression on the provided datasets. This is a good approach because it is quite simple, so not a lot of details are needed. Also, if a team argues that ten years is not a long time, then it is reasonable to assume that most other regression models could look quite similar to a line. The following is a screenshot of their results:
The figure is fairly straightforward, is well labeled, and allows us to directly compare cigarette use and e-cigarette use over time. One place where their submission was not as strong was in one of their key assumptions, which is given below:
- Assumption: Nicotine/Tobacco product usage trends will have a linear pattern in the coming decade. Justification: Both Normal Average and Exponential lines-of-best-fit proved to be highly problematic in their ability to project nicotine product usage. Therefore, a linear trend must be assumed.
While it is excellent to include this kind of assumption, their justification is quite vague. As I read this justification, I am left wondering why the methods they mentioned are “problematic” and why linear trend is not “problematic”? After looking at Part 1 of our blog series and the submission above, we know that there are issues related to “physical interpretation” of the regression methods, but the linear regression runs into the same issue. To strengthen the justification, this team should discuss more explicitly what was “highly problematic” about these other methods. Also, there are a plethora of other fits to try (logarithmic, for example), so the team may also want to comment on why the linear model is the best.
Extra Practice
- Do you think the above assumption is a good assumption to make for this problem? If yes, rewrite the justification to improve the argument. If no, write down a different assumption and justification and consider how this team’s model might change as a result.
The next submission we will examine was given a mid-level score. The team starts out with a list of very good assumptions along with some very brief justifications, like
- Assumption: Teens had the same access to cigarettes as they do to vaping. Justification: This allows for equal comparisons of the two forms of nicotine transmission.
- Assumption: Once a health issue is discovered, the vaping growth rate will decrease similarly to the decrease of cigarette usage after 1964. Justification: This can be assumed because of the known detrimental effects of nicotine.
The first justification is quite vague. As a reader, I am unsure as to what “equal comparison” means. Are they trying to define what a “cigarette user” and a “vape user” are so the dependent variables can be compared? Or, are they trying to equate a specific type of cigarette purchase to a vape purchase? Also, as I read the rest of the report, I am unsure as to exactly how “access” factors into their model. These are components of assumptions that appear in plenty of other submissions, so having them is not a bad idea at all. However, if we consider our submission as a series of logical arguments, it is important to consider how your assumptions flow into the later parts.
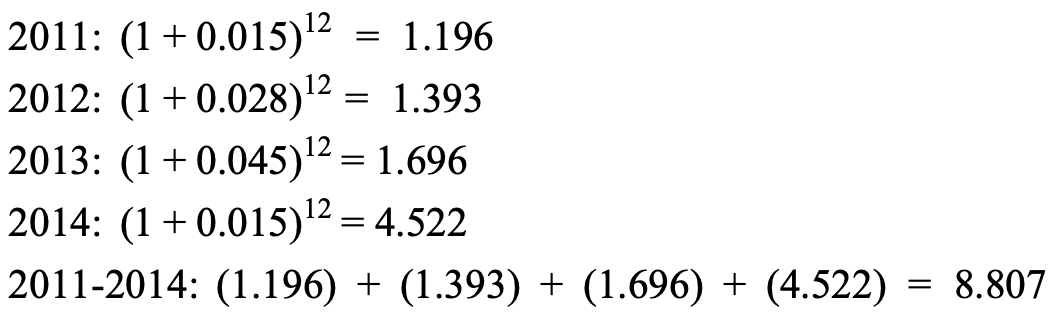
The team then describes their model; they created a compound interest formula for the growth in percentage of both cigarette and vape usage. They then go through the calculations necessary to reach their result, as shown below:
This is a good place to highlight that your submission is not the same as your homework. While your instructors may care about the nuts and bolts of your computations, judges want to see just enough work that your results are reproducible. In this case, a compound interest model is something I feel does not warrant space for computations. This space might better be used in adding a table or figure, or in adding more details to the model explanation or justifications.
If you do feel that your model is quite complex, you might consider giving a short sample scenario. It’s good to keep these sample calculations in your notes and then tentatively include them in the report, but if your report is too long then sample calculations are good things to consider removing first.
Other Mathematical Methods
As mentioned above, a majority of teams tackled this problem using a regression approach. This has many advantages, one of which is that it is easy to implement and write about. However, if you would like your model to more deeply explain how individual factors build to population-level dynamics, then more advanced mathematical methods could be beneficial. For this section of the blog, we will briefly examine more advanced modeling frameworks. When used correctly, these models can allow a team to make meaningful connections between the inputs and outputs of the model.
However, this is not a recommendation to build a highly involved model that your team is not comfortable with. Plenty of high scoring and winning submissions use simple statistical/mathematical approaches and solid arguments. So, if your team is uncomfortable using a specific type of math, then don’t use it!
Ordinary Differential Equations Model
A few teams created what is known as a Susceptible, Infected, and Recovered (SIR) model to model the spread of nicotine use over time. This is an approach that may be beyond the scope of your mathematical education thus far, so we won’t dwell too much on it. If you would like to know more, consider watching the fourth installment of our
Essentials of Math Modeling Series. The important thing to point out about simple infectious disease models is that you can generate functions that look very close to (or in some cases, are exactly) the functions we are using in our regression methods!
The first, second, and fifth place teams all utilized differential equations in their solutions, which can be found
here. The submission we will be looking at next was not a winning submission, but was quite close. The team has a nice setup of their model and explains it well. For example, they provide the following table for their formulae and parameters:
Next, the team spends quite a bit of the submission (perhaps too much) explaining how they compute an important parameter in SIR models, called
R0, from the available data. This parameter is a measurement for how many people on average a single infectious person ends up infecting. Finally, they give the following plot as their main result:
Like the figures in the submissions that utilize regression, we can visually see the increase in the “Infected” group (corresponding to active users of e-cigarettes) up to 10 years, then a slight decline. The group does not go into a sensitivity analysis, and they have short section on strengths and weaknesses for their entire submission at the end, which does not discuss any future directions.
As we mentioned earlier, a sensitivity analysis, particularly on this all-important
R0parameter, might be a good idea to include to show how much variability exists in your model. Also, it is a good idea to refer back to your assumptions and discuss how they match up with your results, and where you could alter your assumptions or conduct further testing in the future. Thinking about the logical arguments you are making as well as the problem outside of the context of the competition are things readers would love to see!
Extra Practice
These questions ask you to compare and contrast the submission we just looked at and the first, second, and fifth place submissions, which you can find
here.
- What similarities and differences do you note in the assumptions? What assumptions are made in the SIR models that are not made in the regression models, and vice versa?
- What similarities and differences do you note in the figures? How does the formatting look (i.e. is the text big enough, are the different curves clearly labeled, is there spacing between table entries, etc.)? If you looked only at a team’s figures and tables (and their captions), could you understand the team’s results?
- Consider each team’s model. Is it clear what they are trying to do? Are the variables clearly marked or labeled in some way? Is there an aspect of their model or their results that go against the team’s assumptions?
Closing Thoughts
We hope that these two “You’ve Got to be Modeling Me” blog posts give you a roadmap for getting started with this year’s M3C. Of course, each competition consists of three parts. Parts 2 and 3 are much more open ended, will often require extra research, and really benefit from teams dividing up tasks. Stay tuned for future resources from me and Wesley for those parts as well!
What is certainly applicable to all parts of the M3C (and math modeling in general) is that the arguments that are made in your submission are just as important (if not more important) than the mathematics. Quality submissions help your reader understand how your modeling choices factor into your results and highlight strengths and weaknesses of your work. Who knew writing would be so useful in doing math?


评论
要发表评论,请点击 此处 登录到您的 MathWorks 帐户或创建一个新帐户。