I've received several questions over the past months about the search order for the function bwlabel and whether it can be changed. Today's post discusses the search-order issue, how useful it might or might not be to change it, and how to use regionprops to reorder labeled objects.
First, though, a brief review of bwlabel: It takes a binary image, bw, and produces a label matrix, L. The elements of L are integer values greater than or equal to 0. The elements equal to 0 are the background. The elements equal to 1 make up one object, the elements equal to 2 make up a second object, and so on. Here's a small example.
bw = false(5, 5); bw(1:2, 1:2) = true; bw(4:5, 1:2) = true; bw(1:2, 4:5) = true; bw(4:5, 4:5) = true
bw =
1 1 0 1 1
1 1 0 1 1
0 0 0 0 0
1 1 0 1 1
1 1 0 1 1
L = bwlabel(bw)
L =
1 1 0 3 3
1 1 0 3 3
0 0 0 0 0
2 2 0 4 4
2 2 0 4 4
So bwlabel found four connected groups of foreground pixels in bw. Since bwlabel scans the pixels of bw of column order, it finds the object in the lower-left corner second, which is why those pixels are labeled with a "2" in L.
Sometimes people ask if bwlabel can be made to search along the rows instead of along the columns, because they want the object in the upper right to be found second.
The search order for bwlabel is determined by the internal memory storage order of elements in MATLAB. Searching along rows would substantially slow the function down. However, it is possible, with the assistance of regionprops, to efficiently postprocess the output of bwlabel so that objects are ordered however you wish.
Before I show that technique, though, let me show an example of how ordering objects in two dimensions is not always straightforward, no matter which way you search.
Here's a snippet of a scanned text image we've look at before:
url = 'http://blogs.mathworks.com/images/steve/186/scanned_page.png';
bw = imread(url);
bw = ~bw(1107:1194, 17:135);
imshow(bw)
One might expect that bwlabel would label the upper-left corner "s" as the first object found. But that doesn't happen.
L = bwlabel(bw);
% Show the object labeled first.
imshow(L == 1)
Why is the F found first? We can see why if we zoom in on the upper-left corner of the image.
set(gcf, 'Position', [100 100 400 300]) imshow(bw(1:50, 1:20), 'InitialMag', 'fit')
The serif on the upper-left of the "F" extends to the left of the letter "s." Therefore, the columnwise scan performed by bwlabel finds the "F" first.
We could force a row-wise labeling search by transposing the binary image and then the output of bwlabel, like this:
L = bwlabel(bw')';
But another surprise awaits; the first object found still isn't the "s"!
imshow(L == 1)
The "t" is found first, because the vertical stem of the "t" extends higher than the top of the "s" character.
Also, bwlabel will merge two or more initially assigned labels if it discovers along the way that two or more apparently separate objects are actually connected. This can change the labeling order in unexpected ways.
With those cautionary notes in mind, let me show you how to postprocess the output of bwlabel to sort objects as desired.
First, let's use regionprops to get some object measurements that might be useful for object ordering.
s = regionprops(L, 'BoundingBox', 'Extrema', 'Centroid');
We could sort the objects from left to right according to the left edge of the bounding box.
boxes = cat(1, s.BoundingBox); left_edge = boxes(:,1); [sorted, sort_order] = sort(left_edge); s2 = s(sort_order);
Let's visualize that sort order.
I = im2uint8(bw); I(~bw) = 200; I(bw) = 240; set(gcf, 'Position', [100 100 400 300]); imshow(I, 'InitialMag', 'fit') hold on for k = 1:numel(s2) centroid = s2(k).Centroid; text(centroid(1), centroid(2), sprintf('%d', k)); end hold off
To sort according to a row-wise search order, sort lexicographically (using sortrows instead of sort) on the left-most top extremum of each object. This extremum is the first row of the 'Extrema' output from regionprops.
extrema = cat(1, s.Extrema); left_most_top = extrema(1:8:end, :); [sorted, sort_order] = sortrows(fliplr(left_most_top)); s2 = s(sort_order); imshow(I, 'InitialMag', 'fit') hold on for k = 1:numel(s2) centroid = s2(k).Centroid; text(centroid(1), centroid(2), sprintf('%d', k)); end hold off
Notice how the characters still aren't well-ordered from left to right. That's because the taller ones get sorted earlier. Let's try sorting first on the bottom of each character instead of the top, and quantizing the bottom coordinate. The left-most bottom extremum is the 6th row in 'Extrema' measurement.
left_most_bottom = extrema(6:8:end, :); left = left_most_bottom(:, 1); bottom = left_most_bottom(:, 2); % quantize the bottom coordinate bottom = 6 * round(bottom / 6); [sorted, sort_order] = sortrows([bottom left]); s2 = s(sort_order); imshow(I, 'InitialMag', 'fit') hold on for k = 1:numel(s2) centroid = s2(k).Centroid; text(centroid(1), centroid(2), sprintf('%d', k)); end hold off
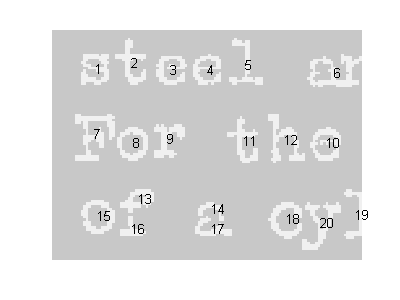
That's somewhat better, but to get further I imagine that some higher-level analysis of the structure of text lines in the image will be necessary.
Notice that I did not modify the label matrix, L, in these postprocessing steps. Next time I'll show how to relabel L.
Get
the MATLAB code
Published with MATLAB® 7.6


For finding the letter in order, why don’t you just use the centroids of each letter (object), then sort by (xC,yC) coordinators? (It may need to round off xC,yC (or threshold them to several levels, depend on the space between letter, and space between line ) before sorting).
Is it possible?
Trung—Yes, certainly that’s possible. I almost included it as an example, but the post was already getting kind of long. The code would look very similar to what I showed above with the extrema points. The main point I was trying to make is that users can use code like this to order sort labeled objects according to whatever criteria they like.
So this is very useful, but I am a newbie to matlab.
I read the help listing for all the terms and commands. I am lost in when you start including extrema. i think you basically defined it then entered in coordinates.
Do you think that you can explain it in an even simpler way?
Thanks so much Steve!
Lester—The notion of extrema wasn’t central to the point I was trying to make. I didn’t really define it here, nor did I enter any extrema coordinates manually. The extrema points were computed by the call to regionprops. If you look at the reference page for regionprops, you’ll find a diagram illustrating extrema points. You can also look at my 20-Aug-2008 post for another example related to extrema points.
Thanks Steve. When I mentioned it, I meant the process of changing the way bwlabel labels the groups.
I understand a different way to get what I needed. But with a new way comes new problems. I am hoping that you can help me with visualizing this code.
1.function output = bubblecount (img, xmin, xmax, width, height)
2.rect=[xmin, xmax, width, height];
3.crop = imcrop(img, [rect]);
4.%imshow(crop)
5.%imtool(crop)
6.filtered = medfilt2(crop, [8,8]);
7.[L,num]= bwlabel(filtered,4);
8. %i=1:num; [a:num]=(L==i); montage[a:num]
11.count= [];
12.for i=1:num %start of for loop to count i which is an index. The index changes for each loop
13. [r,c] = find(L==i);
14. rc = [r c];
15. pixcount = size(rc,1);
16. if pixcount > 100
17. count = vertcat(count, pixcount);
18. end
19.end
20.%montage([L==1 L==2 L==3 L==4 L==5 L==6 L==7 L==8 L==9 L==10 L==11 L==12 L==13 L==14 L==15 L==16 L==17 L==18 L==19]);
21.output = count;
The images that I am processing with this function are binary and I’m looking or the pixel count of certain groups.
So the for loop displays a num x 1 array. The num is determined by bwlabel but then filtered with the if statement.
I ideally want to display and image for the values of the array so I can match the values from picture to picture. Line 20 is my attempt at doing that, but it display everything that num generated before the if statement filtered it.
Can you guide me to the solution for this. It is a mixture of what you have talked about in some of your recent posts. Also it is not homework it is understanding syntax and what the commands montage and bwlabel do which again I am too new even understand some of the explainations for these pocesses. Thank you so much.
Lester—I read your description a couple of times but still failed to fully understand it. In particular, I’m stuck on the meaning of “I ideally want to display an image for the values of the array so I can match the values from picture to picture.” Can you try to clarify exactly what you want to display?
Ok Thanks so much for reading it!
So 11.count= [];
17. count = vertcat(count, pixcount);
21.output = count;
the output gives an array displaying the pixel count for the image. It’s counting the 1’s that form an object with a size larger than 100.
The array just gives numbers and I want to see the image that corresponds to each output number.
I tried using montage but I can’t get the syntax right.
Does this help? Any ideas?
Lester—Ah. Maybe something like this will do it:
Thanks.
So this displays the cropped image with all the white objects. The array may have only 9 outputs, but the figure shows 13.
hello,
I want making correspondance between regions labels in two images (images of the same building scene), so, initially, i segmented these images (according region segmentation technique), in order to labeling regions in each image i use regionprops.
my question is: which is the best criterions to order labeled objects?and how? knowing that this criterion must help me to doing correspondance between two images regions?
I chosed centroid criterion according:
[Ld,numd] = bwlabel(right_image); [Lg,numg] = bwlabel(left_image); cgd=regionprops(Ld,'Centroid'); figure(8),subplot(1,2,1),imshow(right_image) hold on for k = 1:numel(cgd) c = cgd(k).Centroid; text(c(1), c(2), sprintf('%d', k), ... 'Color', 'b', ... 'FontWeight', 'bold',... 'HorizontalAlignment', 'center', ... 'VerticalAlignment', 'middle'); end hold off cgg=regionprops(Lg,'Centroid'); figure(8),subplot(1,2,2),imshow(left_image) hold on for k = 1:numel(cgg) c = cgg(k).Centroid; text(c(1), c(2), sprintf('%d', k), ... 'Color', 'b', ... 'FontWeight', 'bold',... 'HorizontalAlignment', 'center', ... 'VerticalAlignment', 'middle'); end hold offBut, i found it false way because same regions don’t have same centroids in two images.
can you help me please?
NB: I have matlab v.7.6(R 2008a).
Salem—Tinkering with ordering of the labeled objects is probably not going to help with determining correspondences between images. I don’t have any suggestions for you.
hello steve,
I am Jagadish. I would like to know the stastical formula based on which centroid of an image is caluclated by the function regionprops.
Thank you
Jagadish—The centroid is computed by taking the mean of the x- and y-coordinates of the pixels in each region. See the function ComputeCentroid in regionprops.m, and the description of the centroid in a calculus text.
Hi all,
there is a simply way of scanning the image along the rows using bwlabel. The idea is to separate the characters along the rows and eliminate the line space amongst the rows and then take one row at the time. Of course, this only works when there is no connection between the text rows. Below is one example:
url = 'http://blogs.mathworks.com/images/steve/186/scanned_page.png'; bw = imread(url); bw = ~bw(1107:1194, 17:135); imshow(bw) % Initialize WP = 1:size(bw,1); % Assign 0 to the lines between characters % and 1 to the lines filled with characters for i = 1:size(bw,1) l = length(find(bw(i,:) == 0)); if (l == size(bw,2)) WP(i) = 0; else WP(i) = 1; end end % Find and separate the image in row-character-blocks startofblock = strfind(WP, [0,1]); endofblock = strfind(WP,[1,0]); statistics = []; for i = 1:size(startofblock,2) subplot(5,2,i); imshow(bw(startofblock(i)+1:endofblock(i),:)) stats = regionprops(bwlabel(bw(startofblock(i)+1:endofblock(i),:)),'Image'); statistics = cat(1, statistics, stats); endThe only problem is that we have 20 characters instead of 19. More precisely, two caracters (”a” and “r” are viewed as one connected character “ar” as they are actually connected. On the other hand there are 2 characters that are disconnected (see “f” and “a” from the last line). However, this is another story and you can use some other algorithms for segmentation and character connection before segmentation.
Best regards,
IB
Hello,
How to take BoundingBox of all objects as single object. Then want to crop region by using BoundingBox parameters.
Thanks
u1ukbek—Pass your binary image directly to regionprops. Use the bounding box parameters to compute the first and low rows and columns and then use ordinary MATLAB array indexing to extract the subimage.
One trick I have used is a template match…for example if the text is a fixed space font, I know where possible character centers will be and I match the connected component to the nearest possible location. This way the object is identified in a postion I expect it to be in and allows me to “track” objects in a series of images as long as they don’t move too far. If an object is missing at a location, I just skip that component label…if two objects appear close to the same location, I can consider if these are one object that is broken. This obviously has problems if spacing is real tight and/or the template is offset too much. In most cases I use a VERY good image to automatically build the template for future images
John—Thanks for the tip.