
False-color visualization of binary image object sets
Today I want to demonstrate a useful technique to produce a false-color visualization of different sets of binary image objects. Here's the sample image that we'll use:
url = 'https://blogs.mathworks.com/images/steve/2008/segmented_rice.png';
bw = imread(url);
imshow(bw)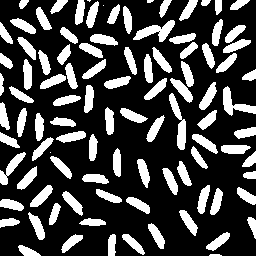
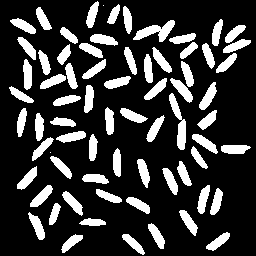
Let's look at two sets of objects: Those that touch the image border, and those that do not.
notouch = imclearborder(bw);
imshow(notouch)
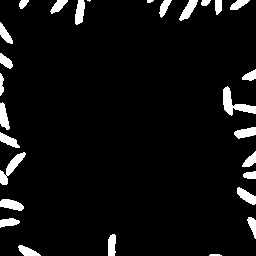
The objects that do touch the border can be computed using logical operators:
touch = bw & ~notouch;
imshow(touch)
Here's one way to turn these two sets of objects into a single, false-color, indexed image. First, initialize the index matrix:
X = zeros(size(bw), 'uint8'); % Did you know about
                              % this way to call zeros?
Now assign 1 to the elements of X corresponding to the border-touching set, and assign 2 to the elements corresponding to the interior set.
X(touch) = 1;  % Logical indexing!
X(notouch) = 2;
Now we just need to pick some colors for the color map. I'll make the background white:
map(1,:) = [1 1 1];
Make the touching objects be purple-ish.
map(2,:) = [0.7 0.3 0.8];
And use a green shade for the removed objects.
map(3,:) = [0.4 0.8 0.7];
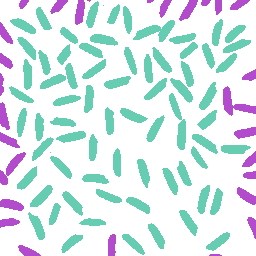
Now we can display the resulting indexed image.
imshow(X,map)


Comments
To leave a comment, please click here to sign in to your MathWorks Account or create a new one.