
SVD Quantifies Increasing Partisanship in the U. S. Senate
Many observers have noted that the United States Senate has become increasingly partisan in recent years. Votes are being made more frequently along strict political party lines. The singular value decomposition, the SVD, of matrices derived from records of roll call votes in the senate can measure this partisanship.
Contents
The Senate
The web site www.senate.gov has year-by-year records of voting in the senate. We are going to look at the 32 years from 1989 to 2020.
Senators serve six-year terms and every two years about one-third of the senate stands for reelection or new senators are elected. So, a new "Congress" convenes every two years and has two year-long "Sessions". The first session was in 1789. The 101-st Congress began in 1989 and this year, 2020, is the 2nd Session of the 116-th Congress.
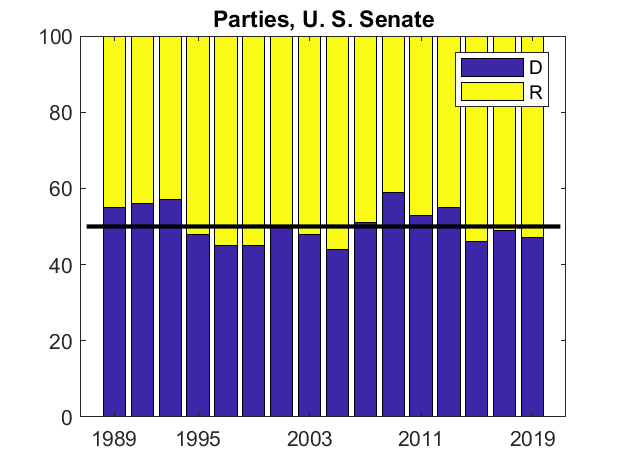
This bar chart shows the division between the Republican and Democratic parties over our time period. The data from the web site party division comes with the caveat, "The actual number of senators representing a particular party often changes during a Congress, due to the death or resignation of a senator, or as a consequence of a member changing parties."
The Data
The URL
https://www.senate.gov/legislative/LIS/roll_call_votes/ ...
   vote1162/vote_116_2_00033.xml
points to the record of a roll call vote taken in the senate early this year. The congress number, 116, and the session, 2, each appear twice. The 33 signifies this is the 33rd vote of this session.
This an XML record. XML is the abbreviation for eXtensible Markup Language, an important standard from the WWW Consortium defining a format for encoding documents that is both human and machine readable. I was pleased to find MATLAB Central File Exchange 28518-xml2struct by Wouter Falkena. As the function name implies, this handy code "converts an xml file into a MATLAB structure for easy access to the data."
You can also use your browser to access the example URL and (a) examine the XML, and (b) see why bills 33 and 34 from year 2020 are not typical measures before the Senate.
The Matrices
Once you find your way through the layers of structure that results from the XML, you will have many details about each senate roll call vote. In particular, for each senator who voted, you will have a structure with fields full name, last name, first name, party, state, vote, and member id.
For each year, we create a matrix of +1s, -1s, and 0s. A +1 is for a vote of "Yea" or "Guilty", a -1 is a "Nay" or "Not Guilty", and a 0 is for anything else, which includes "Not Voting", "Present" (abstain), and something too complicated to explain called "Present, Giving Live Pair". Because there are 100 senators, the matrix has 100 rows. The number of columns is the number of roll call votes taken that year. The matrices range in size from 100-by-163 for 2016 to 100-by-613 for 1995. The matrix for 2020 is not yet complete; as of August 6, there were 157 columns.
The XML is organized using last names of senators in alphabetic order -- Alexander (R-TN), Baldwin (D-WI), Barrasso (R-WY), ..., Young(R-IN). At first, I tried to create matrices with rows in this order. But senators retire or die in midsession, so this ordering proved to be difficult to manage correctly. Ultimately, I decided to order the rows by states. Each state is allocated two rows; the name of the specific senator occupying each row is irrelevant. After the matrix for a given year is complete, I reorder the rows so that all the senators from each party are grouped together. The one or two senators who declare themselves to be independent (but who caucus with a major party) are between the two parties.
The Matrices
Here are the matrices, 32 of them, one for each session from 1989 to 2020. Yellow is "Yea" or "Guilty", dark blue is "Nay" or "Not Guilty", and turquoise is not present, abstain or other.
Partisanship
The SVD of these matrices provides the basis for our analysis. The singular values decrease very rapidly with increasing index, so the matrices can be well approximated by matrices of rank two. When viewed from the record of roll call votes, the U. S. Senate is nearly two-dimensional.
Let A(y) be the matrix of 1s, -1s and 0s summarizing the roll call votes in year y. Let
sigma = svd(A(y))
Then the partisanship for year y is defined to be
1-sigma(3)/sigma(1)
This quantity measures how close the voting pattern is to being two-dimensional.
Compare
Let's compare the least partisan and most partisan years between 1989 and 2020. They turn out to be 1991 and 2014. A good way to see the structure of these matrices is to view them as images. I have also included "coinflip", a matrix of random +1s and -1s where there is a complete lack of party line voting.
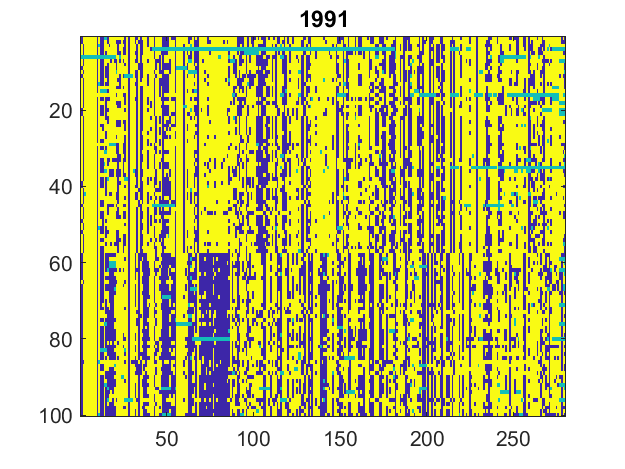
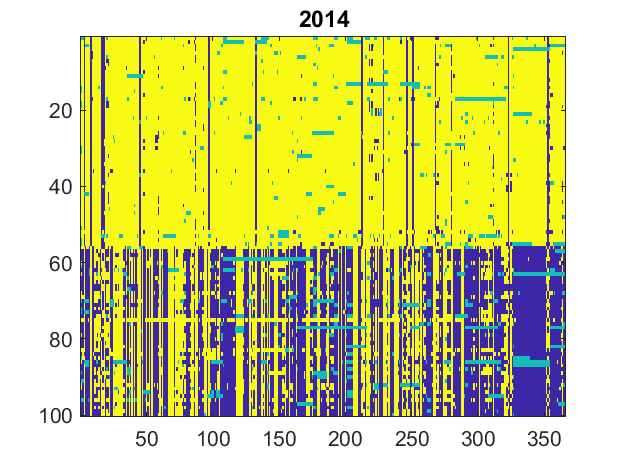
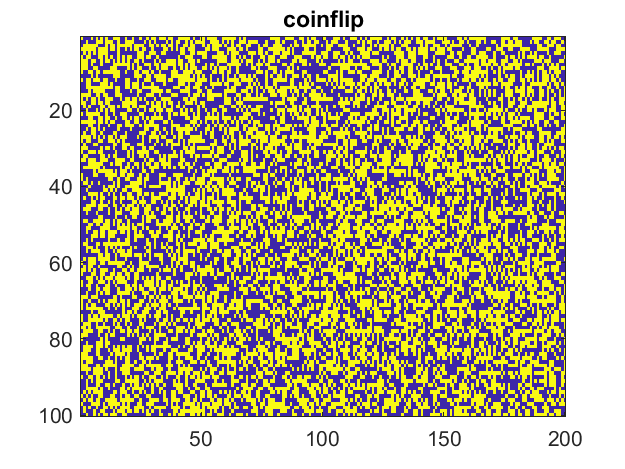
You can immediately see that 2014 has much less detailed structure than 1991; it is closer to being two-dimensional.
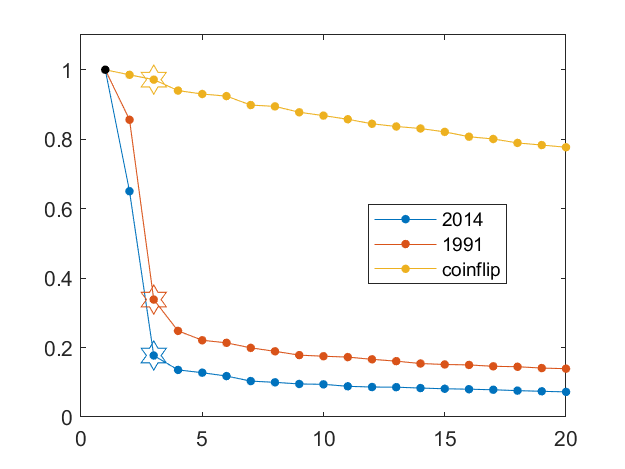
The next plot shows the distribution of the first twenty singular values, normalized so that sigma(1) = 1. The third singular value is highlighted. The year 2014 is more partisan than the year 1991, and, as expected, they both show far more party line voting than random coin flips.
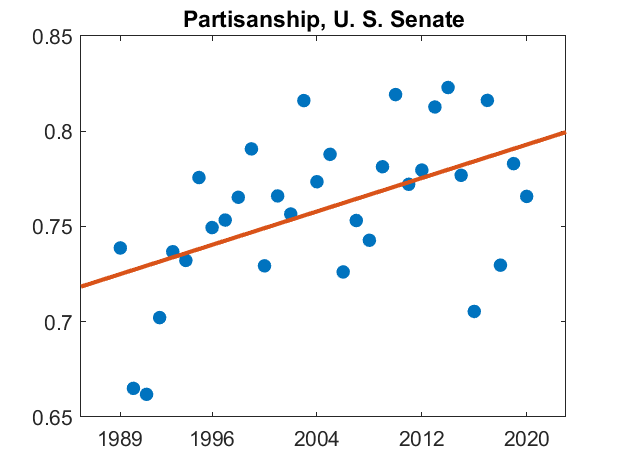
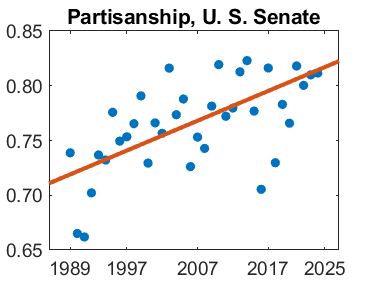
Increasing Partisanship
Finally, here is this measure of partisanship for each year from 1989 to 2020, and a linear least squares fit. With this much scatter is the values, the exact fit can't be taken too seriously. But there is definitely an upward trend. Partisanship in the U. S. Senate has increased from about 70% thirty years ago to about 80% today.
- カテゴリ:
- History,
- People,
- Singular Values


コメント
コメントを残すには、ここ をクリックして MathWorks アカウントにサインインするか新しい MathWorks アカウントを作成します。