
Building a High Five Counter Using Deep Learning
This post is from Brian Douglas, YouTube Content Creator for Control Systems and Deep Learning Applications
For about a decade, I've wanted to implement this silly idea I had of measuring the acceleration of a person's hand to count the number of times they high five throughout the day. I wasn't sure how to accomplish this using the rule-based approaches to algorithm development that I was familiar with and so the project sat on hold. It was only while I was making the MATLAB Tech Talk video series on Deep Learning that I realized that Deep Learning was perfect for solving this problem!

The topic for the 4th video in the series was transfer learning and it turned out that was the key concept that I needed for me to quickly get a high five counting algorithm up and running. In this blog post, I will walk through the details of the code I wrote and the tools I used to get my high five counter working for that video. Hopefully, you can use this as a starting point to solve those difficult classification problems that you've been sitting on for the last 10 years as well.
This post is divided into the following sections:
So, let's get to it!
An Overview of the Hardware
The hardware set up is pretty simple. I have an accelerometer that is connected to an Arduino Uno through an I2C bus. The Arduino is then connected to my computer through USB.

To sense acceleration, I'm using the MPU-9250. It's a 9 degree of freedom inertial measurement unit from TDK InvenSense. Instead of integrating the chip into my own custom circuit design, I am using a breakout board that exposes power, ground, and the I2C communication pins. The only reason I am using this particular chip is because I already had one lying around, but any accelerometer will work as long as it's small enough to be moved around quickly by hand.
You can see that my hardware setup was pretty crudely constructed with a breadboard and some jumper wires but I think it's kind of nice that you don't need to set up anything too fancy for this to work.

Reading the Accelerometer in MATLAB
To read acceleration from the MPU-9250 through the Arduino, I'm using the MATLAB Support Package for Arduino Hardware. This package allows you to communicate with an Arduino without having to compile code for it. Plus, there is a built in mpu9250 function that allows you to read the sensor with a one-line command.
It only takes three lines of code to connect to the Arduino, instantiate an MPU9250 object, and read the accelerometer.

Data Preprocessing and the Scalogram
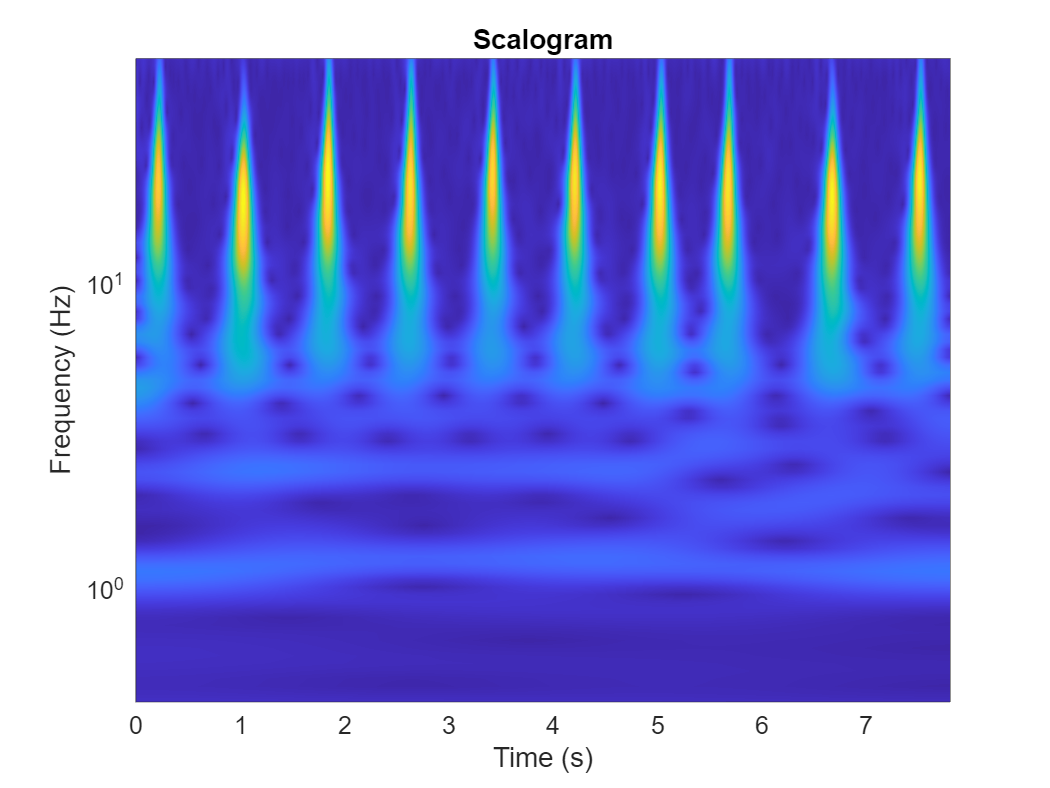
If you watched the 4th video in the Tech Talk series on deep learning, you'll know that I opted to convert the 3-axis acceleration data into an image to take advantage of GoogLeNet - a network trained to recognize images. In particular, I used a continuous wavelet transform to create a scalogram.
A scalogram is a time-frequency representation that is suitable for signals that exist at multiple scales. That is, signals that are low frequency and slowly varying, but then are occasionally interrupted with high frequency transients. It turns out they are useful for visualizing acceleration data for the occasional high frequency high five within an otherwise slowly moving hand.

A cleaned-up version of the MATLAB code that I used to make the above plot is in the following collapsible block.
close all
clear

 % If your computer is not able to run this real-time, reduce the sample
% rate or comment out the scalogram part
fs = 50; % Run at 50 Hz

a = arduino('COM3', 'Uno', 'Libraries', 'I2C');  % Change to your arduino
imu = mpu9250(a);

buffer_length_sec = 2; % Seconds of data to store in buffer
accel = zeros(floor(buffer_length_sec * fs) + 1, 3); % Init buffer

t = 0:1/fs:(buffer_length_sec(end)); % Time vector

subplot(2, 1, 1)
plot_accel = plot(t, accel); % Set up accel plot
axis([0, buffer_length_sec, -50, 50]);

subplot(2, 1, 2)
plot_scale = image(zeros(224, 224, 3)); % Set up scalogram

tic % Start timer
last_read_time = 0;

i = 0;
% Run for 20 seconds
while(toc <= 20)
    current_read_time = toc;
    if (current_read_time - last_read_time) >= 1/fs
        i = i + 1;

        accel(1:end-1, :) = accel(2:end, :); % Shift values in FIFO buffer
        accel(end, :) = readAcceleration(imu);

        plot_accel(1).YData = accel(:, 1);
        plot_accel(2).YData = accel(:, 2);
        plot_accel(3).YData = accel(:, 3);

        % Only run scalogram every 3rd sample to save on compute time
        if mod(i, 3) == 0

        fb = cwtfilterbank('SignalLength', length(t), 'SamplingFrequency', fs, ...
            'VoicesPerOctave', 12);
        sig = accel(:, 1);
        [cfs, ~] = wt(fb, sig);
        cfs_abs = abs(cfs);
        accel_i = imresize(cfs_abs/8, [224 224]);


        fb = cwtfilterbank('SignalLength', length(t), 'SamplingFrequency', fs, ...
            'VoicesPerOctave', 12);
        sig = accel(:, 2);
        [cfs, ~] = wt(fb, sig);
        cfs_abs = abs(cfs);
        accel_i(:, :, 2) = imresize(cfs_abs/8, [224 224]);

        fb = cwtfilterbank('SignalLength', length(t), 'SamplingFrequency', fs, ...
            'VoicesPerOctave', 12);
        sig = accel(:, 3);
        [cfs, ~] = wt(fb, sig);
        cfs_abs = abs(cfs);
        accel_i(:, :, 3) = imresize(cfs_abs/8, [224 224]);

        if~(isempty(accel_i(accel_i>1)))
            accel_i(accel_i>1) = 1;
        end

        plot_scale.CData = accel_i;
        end

        last_read_time = current_read_time;
    end
end
Note that this code uses a function called cwtfilterbank to create the scalogram which is part of the Wavelet Toolbox. If you don't have access to this toolbox and you don't want to write the code yourself, try giving another type of time-frequency visualization a shot. Maybe a spectrogram will work or some other algorithm that you come up with. Whatever you choose, the idea here is that we're trying to create an image that will make the unique and identifiable features of a high five pattern obvious. I have shown that a scalogram works, but other methods may work as well.
Creating the Training Data
To train a network to recognize high fives, we need multiple examples of what a high five looks like and what a high five doesn't look like. Since we will be starting from a pre-trained network, we won't need as many training examples as we would if we were training a network from scratch. I don't know exactly how much training data is needed to fully capture the solution space for all possible high fives, however, I collected data for 100 high fives and 100 non-high fives and that seemed to work pretty well. I suspect I could have gotten away with less for the video I was making, but I think if I was really creating a product I would have used a lot more examples. You can play around with the amount of labeled training data and see how it affects the result.
Collecting 200 images seems like a lot of work, but I wrote a script that cycles through them one after another and saves the images in the appropriate folder. I ran the following script twice; once with the 'high_five' label with the images being saved to the data/high_five folder and once with the 'no_high_five' label with the images being saved to the data/no_high_five folder.
  % This script collects training data and places it in the specified
% label subfolder. 3 seconds of data is collected from the
% sensor but only keeps and saves off the last 2 seconds.
% This gives the user some buffer time to start the high five.

% The program pauses between images and prompts the user to continue.

% Note, you'll want to move the figure away from the MATLAB window so that
% you can see the acceleration after you respond to the wait prompt.

close all
clear all

% If your computer is not able to run this real-time, reduce the sample rate
fs = 50; % Run at 50 Hz

parentDir = pwd;
dataDir = 'data';

%% Set the label for the data that you are generating
% labels = 'no_high_five';
labels = 'high_five';

a = arduino('COM3', 'Uno', 'Libraries', 'I2C');  % Change to your arduino
imu = mpu9250(a);

buffer_length_sec = 2; % Seconds of data to store in buffer
accel = zeros(floor(buffer_length_sec * fs) + 1, 3);  % Init buffer

t = 0:1/fs:(buffer_length_sec(end)); % Time vector

subplot(2, 1, 1)
plot_accel = plot(t, accel); % Set up accel plot
axis([0 buffer_length_sec -50 50]);

subplot(2, 1, 2)
plot_scale = image(zeros(224, 224, 3)); % Set up scalogram

for j = 1:100 % Collect 100 images

    % Prompt user to be ready to record next high five
    H = input('Hit enter when ready: ');

    tic % Start timer
    last_read_time = 0;

    i = 0;
    % Run for 3 seconds
    while(toc <= 3)
        current_read_time = toc;
        if (current_read_time - last_read_time) >= 1/fs
            i = i + 1;

            accel(1:end-1, :) = accel(2:end, :);  % Shift values in buffer
            accel(end, :) = readAcceleration(imu);

            plot_accel(1).YData = accel(:, 1);
            plot_accel(2).YData = accel(:, 2);
            plot_accel(3).YData = accel(:, 3);

            % Run scalogram every 3rd sample

            if mod(i, 3) == 0

                fb = cwtfilterbank('SignalLength', length(t), 'SamplingFrequency', fs, ...
                    'VoicesPerOctave', 12);
                sig = accel(:, 1);
                [cfs, ~] = wt(fb, sig);
                cfs_abs = abs(cfs);
                accel_i = imresize(cfs_abs/8, [224 224]);


                fb = cwtfilterbank('SignalLength', length(t), 'SamplingFrequency', fs, ...
                    'VoicesPerOctave', 12);
                sig = accel(:, 2);
                [cfs, ~] = wt(fb, sig);
                cfs_abs = abs(cfs);
                accel_i(:, :, 2) = imresize(cfs_abs/8, [224 224]);

                fb = cwtfilterbank('SignalLength', length(t), 'SamplingFrequency', fs, ...
                    'VoicesPerOctave', 12);
                sig = accel(:, 3);
                [cfs, ~] = wt(fb, sig);
                cfs_abs = abs(cfs);
                accel_i(:, :, 3) = imresize(cfs_abs/8, [224 224]);

                if~(isempty(accel_i(accel_i>1)))
                    accel_i(accel_i>1) = 1;
                end

                plot_scale.CData = accel_i;
            end

            last_read_time = current_read_time;
        end
    end

    % Save image to data folder
    imageRoot = fullfile(parentDir,dataDir);
    imgLoc = fullfile(imageRoot,char(labels));
    imFileName = strcat(char(labels),'_',num2str(j),'.jpg');

    imwrite(plot_scale.CData, fullfile(imgLoc,imFileName), 'JPEG');
end
After running the script, I manually went through my training data and removed images that I thought would corrupt the training. These were images where the high five wasn't in the middle of the frame or images where I knew that I did a poor high five motion. In the below gif, I deleted high five image 49 because it wasn't in the center of the frame.

Transfer Learning and GoogLeNet
With all of my training data in their appropriate folders, the next step is to set up the network. For this part, I was following along with the MATLAB example Classify Time Series Using Wavelet Analysis and Deep Learning, except, rather than run everything through a MATLAB script, I found it easier to set up and train the network using the Deep Network Designer app.
I started from the pre-trained GoogLeNet to take advantage of all of the knowledge this network has for recognizing objects in images. GoogLeNet was trained to recognize things like fish and hotdogs in images - clearly not what I'm looking for - but this is where transfer learning is useful. With transfer learning, I can keep much of the existing network in place and only replace two layers at the end of the network which combine those generic features into the specific patterns I'm looking for. Then when I retrain the network, it's pretty much just these two layers that need to be trained, which is why training is so much faster with transfer learning.

I recommend you follow along with the MATLAB example I used or watch the Tech Talk if you'd like to know exactly how I replaced the layers and what training parameters I used, however, this again is a great place for you to experiment with something different. You can try to start from a different pretrained network like SqueezeNet, or you can replace more layers in GoogLeNet, or change the training parameters. There are a lot of options here and I think deviating from what I did can help you develop some intuition for how all of these variables affect the result.
Training the Network
With the network ready to go, training in the Deep Network Designer App is very simple. In the data tab, I imported the training data by selecting the folder where I saved the set of high five and no high five images. I also set aside 20 percent of the images to be used for validation during the training process.

Then in the training tab, I set my training options. Here, I was using the same options that were used in the MATLAB example that I was following, however, once again I encourage you to play around with some of these values and see how they impact the results.

Training took just over 4 minutes on my single CPU and reached about 97% validation accuracy. Not too bad for a couple hours of work!

Testing the High Five Counter
Now that I have a trained network, I use the function classify from the Deep Learning Toolbox to pass in the scalogram at each sample time and have the network return a label. If the returned label was "high_five" I increment a counter. To keep from counting the same high five several times as the acceleration data streaked across the whole buffer, I added a timeout that would not count a new high five unless it had been at least 2 seconds since the previous high five.
Below is a cleaned up version of the code that I used to count high fives.
close all
clear

%% Update to the name of your trained network
load trainedGN
trainedNetwork = trainedGN;

% If your computer is not able to run this real-time, reduce the sample
% rate or comment out the scalogram part
fs = 50; % Run at 50 Hz

a = arduino('COM3', 'Uno', 'Libraries', 'I2C');  % Change to your arduino
imu = mpu9250(a);

buffer_length_sec = 2; % Seconds of data to store in buffer
accel = zeros(floor(buffer_length_sec * fs) + 1, 3); % Init buffer

t = 0:1/fs:(buffer_length_sec(end)); % Time vector

% Set up plots
h = figure;
h.Position = [100         100        900         700];
p1 = subplot(2, 1, 1);
plot_accel = plot(t, accel);
plot_accel(1).LineWidth = 3;
plot_accel(2).LineWidth = 3;
plot_accel(3).LineWidth = 3;
p1.FontSize = 20;
p1.Title.String = 'Acceleration';
axis([0 t(end) -50 60]);
xlabel('Seconds');
ylabel('Acceleration, mpss');
grid on;
label_string = text(1.3, 45, 'No High Five');
label_string.Interpreter = 'none';
label_string.FontSize = 25;
count_string = text(0.1, 45, 'High five counter:');
count_string.Interpreter = 'none';
count_string.FontSize = 15;
val_string = text(0.65, 45, '0');
val_string.Interpreter = 'none';
val_string.FontSize = 15;
p2 = subplot(2, 1, 2);
scale_accel = image(zeros(224, 224, 3));
p2.Title.String = 'Scalogram';
p2.FontSize = 20;

telapse = 0;
hfcount = 0;

tic  % Start timer
last_read_time = 0;

i = 0;
% Run high five counter for 20 seconds
while(toc <= 20)
    current_read_time = toc;
    if (current_read_time - last_read_time) >= 1/fs
        i = i + 1;
        telapse = telapse + 1;
        % Read accel
        accel(1:end-1, :) = accel(2:end, :); % Shift values in FIFO buffer
        accel(end, :) = readAcceleration(imu);

        plot_accel(1).YData = accel(:, 1);
        plot_accel(2).YData = accel(:, 2);
        plot_accel(3).YData = accel(:, 3);

        % Only run scalogram every 3rd sample to save on compute time
        if mod(i, 3) == 0

            % Scalogram
            fb = cwtfilterbank('SignalLength', length(t), 'SamplingFrequency', fs, ...
                    'VoicesPerOctave', 12);
                sig = accel(:, 1);
                [cfs, ~] = wt(fb, sig);
                cfs_abs = abs(cfs);
                accel_i = imresize(cfs_abs/8, [224 224]);


                fb = cwtfilterbank('SignalLength', length(t), 'SamplingFrequency', fs, ...
                    'VoicesPerOctave', 12);
                sig = accel(:, 2);
                [cfs, ~] = wt(fb, sig);
                cfs_abs = abs(cfs);
                accel_i(:, :, 2) = imresize(cfs_abs/8, [224 224]);

                fb = cwtfilterbank('SignalLength', length(t), 'SamplingFrequency', fs, ...
                    'VoicesPerOctave', 12);
                sig = accel(:, 3);
                [cfs, ~] = wt(fb, sig);
                cfs_abs = abs(cfs);
                accel_i(:, :, 3) = imresize(cfs_abs/8, [224 224]);

            % Saturate pixels at 1
            if ~(isempty(accel_i(accel_i>1)))
                accel_i(accel_i>1) = 1;
            end

            scale_accel.CData = im2uint8(accel_i);

            % Classify Scalogram
            [YPred,probs] = classify(trainedNetwork,scale_accel.CData);
            if strcmp(string(YPred), 'high_five')
                label_string.BackgroundColor = [1 0 0];
                label_string.String = "High Five!";
                % Only count if 100 samples have past since last high five
                if telapse > 100
                    hfcount = hfcount + 1;
                    val_string.String = string(hfcount);
                    telapse = 0;
                end
            else
                label_string.BackgroundColor = [1 1 1];
                label_string.String = "No High Five";
            end
        end
    end
end
And here it is in action!

- Category:
- Deep Learning


Comments
To leave a comment, please click here to sign in to your MathWorks Account or create a new one.