
The evolution of Quantitative Finance in MATLAB (What’s New)
Hi Everyone,
I would like to welcome you to our new blog on Quantitative Finance. To kick things off, I’d like to give an overview of the main areas that we’ve been working on here at MathWorks in the past few MATLAB releases. These include:
- General Capabilities
- Portfolio Management
- Risk Management
- Econometrics
- ESG and Climate Risk
- AI and Quantum Computing
The content of this blog was also presented as a talk! View the video here:
General Capabilities
MATLAB with Python
Did you know that MATLAB works with Python? MATLAB does have the ability to call Python libraries, and Python has the ability to call MATLAB libraries. This is made available via the Python API in MATLAB.
The following webinar highlights how to create a Crypto Currency Prediction model, where the model for prediction is built in MATLAB but the libraries for retrieving the financial data are in Python.
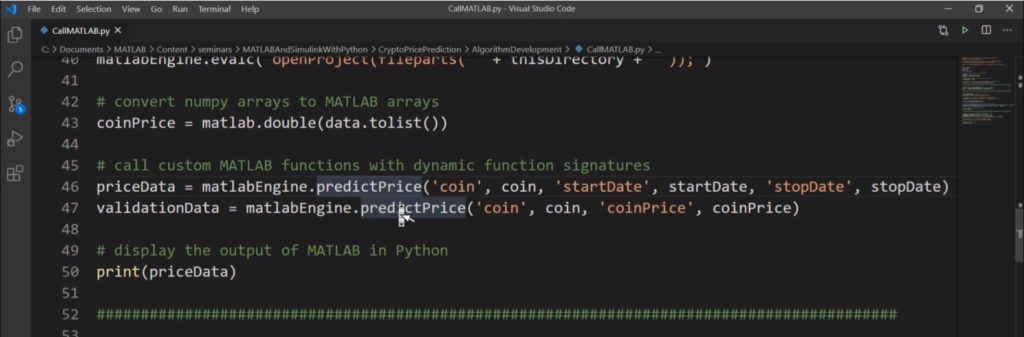
A MATLAB model for predicting crypto currency prices being called from Python
MATLAB with GPUs
MATLAB makes it possible for users to easily access GPU hardware for speeding up their simulations using a function called arrayfun. The following example from R2022b, Using GPU arrayfun for Monte-Carlo Simulations, shows how to use this to speed up option pricing models based on Monte Carlo simulations by up to 100x.
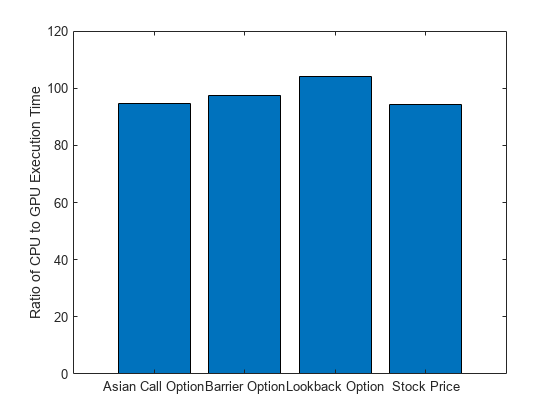
This benchmark for Option pricing models, shows a speed up of close to 100x using a GPU
Portfolio Management
There are 2 main topics to highlight in the area of Portfolio Management.
Backtesting
Backtesting is a useful tool to compare how investment strategies perform over historical or simulated market data.
MathWorks has been heavily focused on making backtesting portfolio strategies as easy as possible for the MATLAB user. This started back in R2020b, where we made it efficient for users to:
- Define backtesting strategies using a backtestStrategy object
- Create a backesting engine using a backtestEngine object
- Run and analyze the backtesting results with the runBacktest and summary
For more information on the backtesting workflow, see Backtest Investment Strategies and Backtest Investment Strategies with Trading Signals.
Since its initial release a steady stream of new features have been added, with someof the main examples being:
- Backtest Strategies Using Deep Learning
- Backtest Using Risk-Based Equity Indexation
- Backtest with Brinson Attribution to Evaluate Portfolio Performance
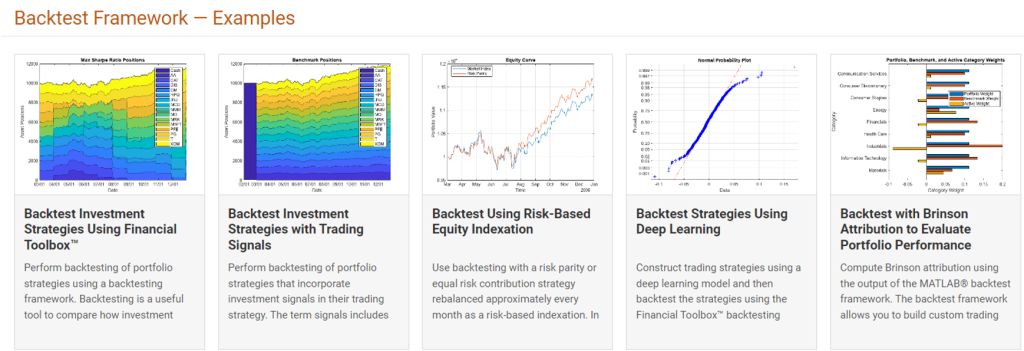
Backtesting Framework examples available in the Financial Toolbox
Comparing Portfolio Optimization Objectives using Experiment Manager
Portfolio optimization is a complex area of financial analysis that involves balancing multiple variables and multiple objectives at once. These variables often may interact with each other, which makes discerning and tuning each variable’s effect on the risk and returns of the portfolio objective difficult.
We’re currently working on an example that shows users how to manage, fine-tune, and explain optimized portfolios using MATLAB’s Experiment Manager App. It’s still a work in progress, but if you would like the source code feel free to contact me for the latest version.
Highlights include:
- Create a Portfolio Optimization experiment in MATLAB’s Experiment Manager app
- Sweep through a range of portfolio optimization parameters
- Backtest and compare the results of different portfolio objectives
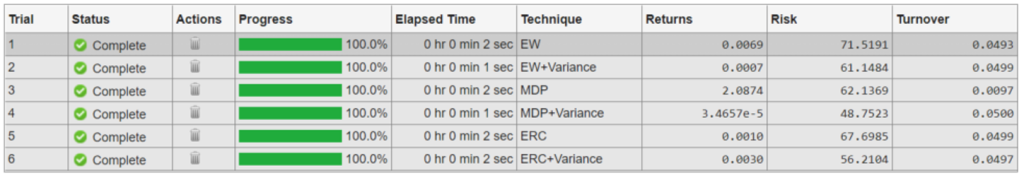
A table in Experiment Manager which shows the results of an experiment that compares different portfolio objectives
Risk Management
Financial institutions strive to reduce the complexity of managing the lifecycle of financial models to improve operational efficiency and mitigate risks. With the increasing complexity and regulatory scrutiny of financial models, managing their lifecycle can be cumbersome and time-consuming.
MathWorks saw an opportunity to help organizations simplify this process, and developed suite of tools into a platform named Modelscape. Modelscape is a platform that enables financial organizations to streamline model development, deployment, and maintenance. It helps to ensure model accuracy, version control, collaboration, and compliance with internal and external regulations, leading to better decision-making, reduced costs, and enhanced model governance.
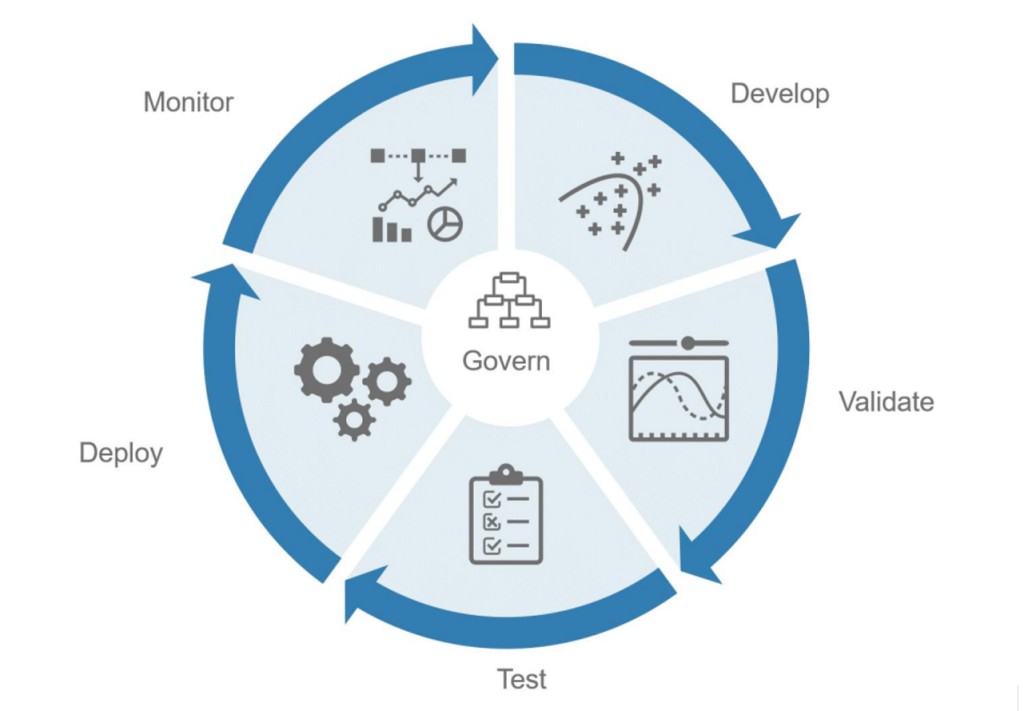
Modelscape: Govern, develop, validate, implement (test and deploy) and monitor models across business lines
A lesson we’ve learnt from those who are adopting Modelscape, is that they’re looking for a solution that is highly customized to their needs, and found value in using MathWorks services to deliver the final solution that met their requirements.
For reference there are 2 customer presentations below that highlight the use of MathWorks tools for model lifecycle management:
Using MATLAB to Move to the Next Generation of GRADE Model
Econometrics
Despite advances in econometric modelling and forecasting techniques, producing accurate model outputs remains challenging. Forecasters need to consider many uncertainties associated with economic data and take an iterative approach to building models when trying to produce and interpret their forecast results.
There are 2 recent additions to MATLAB’s econometrics toolbox to highlight to help users produce and interpret results.
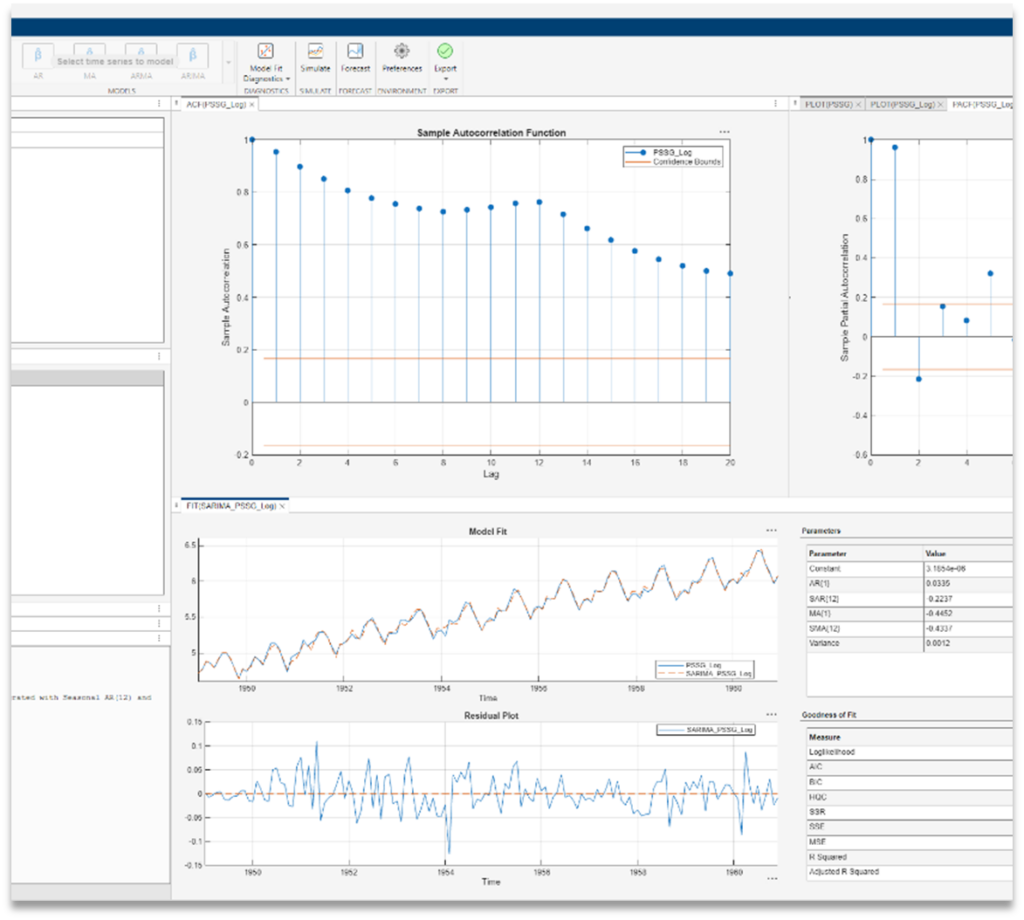
The Econometric Modeler app adds support for fitting multivariate time series models
The Econometric Modeler is an app that helps users perform statistical tests, and build models without the need to program them in code. In fact it will generate code for you. It has been around for a while, supporting univariate modeling, but now supports multivariate modeling. Specifically you can fit vector autoregression (VAR) models, including optional exogenous variables (VARX) or vector error-correction (VEC) models.
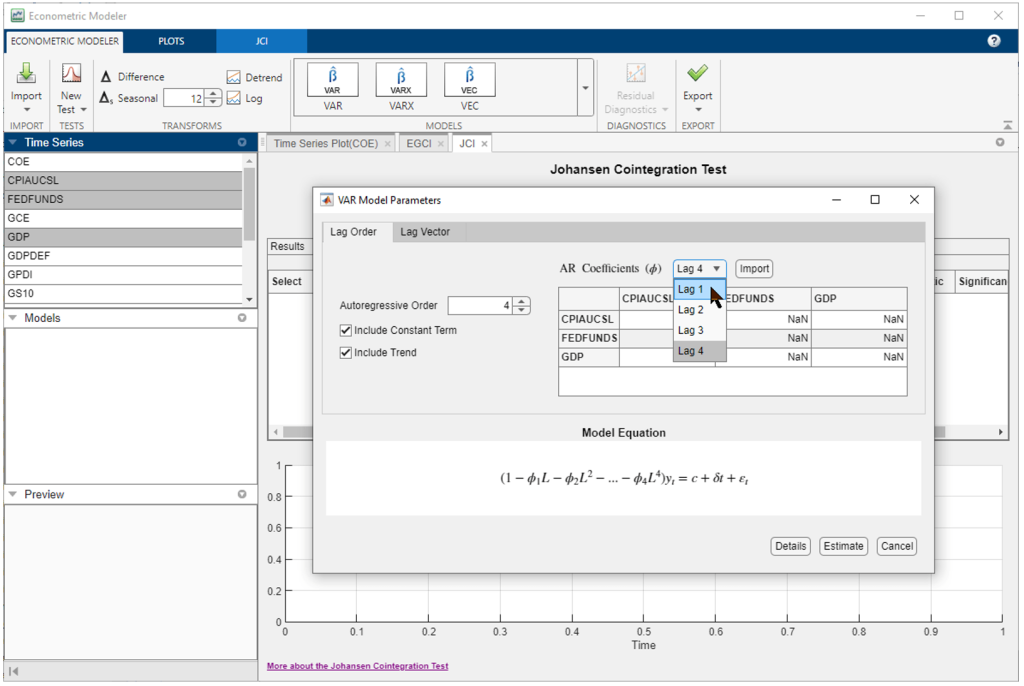
Using the econometric modeler app to create a Vector Autoregressive Model (VAR)
Business Cycle Filters
The forces that shape a macroeconomy cause both long-term trends and temporary fluctuations in econometric data. Long-term secular influences include population growth, capital accumulation, productivity enhancements, and market development. Short-term influences include seasonality, regulatory intervention, central bank policies, technology shocks, and investor outlook. When observed in aggregate over multiple indicators of growth, medium-term variations in the economy are often described as recessions and expansions, or business cycles.
In the latest release of MATLAB we’ve released a number of business cycle filters to allow users to better understand these patterns in economic data.
Different business cycle filters highling medium term trends in economic cycles
ESG and Climate Risk
ESG and Climate Finance are two newer areas of focus for MathWorks. Here’s an overview of what we’re doing in both areas and current examples:
ESG
Environmental, social and governance (ESG) is a framework used to assess an organization’s business practices and performance on various sustainability and ethical issues. It also provides a way to measure business risks and opportunities in those areas. MATLAB enables investors to incorporate ESG factors and climate data into investment decision-making and risk management processes.
To help users understand some of the ways they can incorporate ESG, there are 2 examples in the latest releases:
Climate Risk
The occurrence of extreme climate events, as well as a disorderly transition to a low-carbon economy, could have destabilizing effects on the financial system. Climate-related risk analysis explores the potential impact on the safety and soundness of individual financial institutions and how these might have broader financial stability implications for the banking system.
To help users understand some of the ways they can analyse climate risk, we’ve released 3 examples in the latest releases:
- Analyze Transition Scenarios for Climate-Related Financial Risks
- Assess Physical and Transition Risk for Mortgages
- Measure Transition Risk for Loan Portfolios with Respect to Climate Scenarios
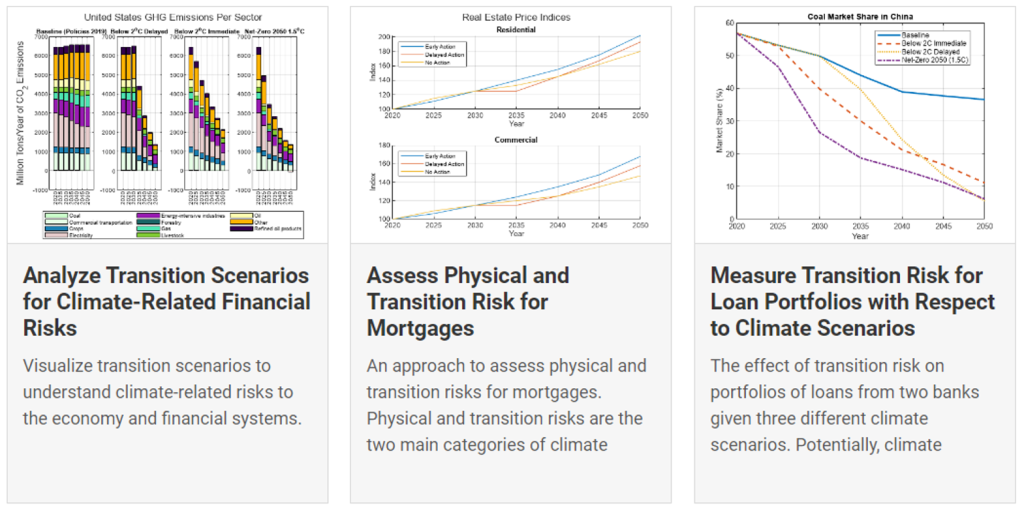
Examples of Climate Risk available in the Risk Management Toolbox
AI and Quantum Computing
AI and Quantum are both exciting areas that MathWorks in general is focusing on, but have unique applications for the Finance Industry.
AI
AI has been making inroads in Finance, and for certain applications has become another option to try and compare against traditional methods. MathWorks has been developing a number of different examples where AI techniques could be applied to augment or improve existing workflows including instrument pricing, trading, and risk management.
- Compare Deep Learning Networks for Credit Default Prediction
- Interpret and Stress-Test Deep Learning Networks for Probability of Default
- Hedge Options Using Reinforcement Learning Toolbox
- Use Deep Learning to Approximate Barrier Option Prices with Heston Model
- Backtest Strategies Using Deep Learning
- Deep Reinforcement Learning for Optimal Trade Execution
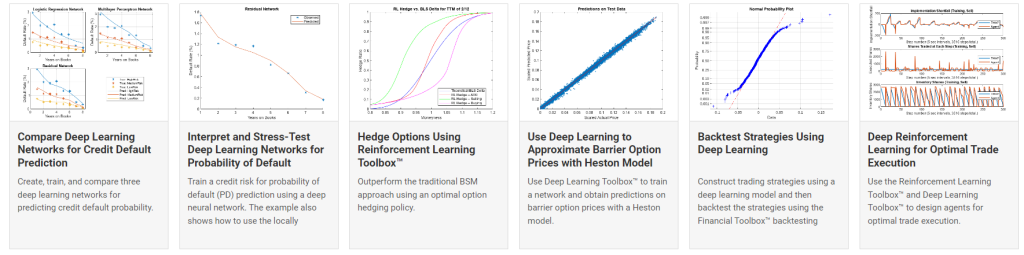
Examples that showcase the use of Deep Learning and Reinforcement Learning in Finance applications
Quantum Computing
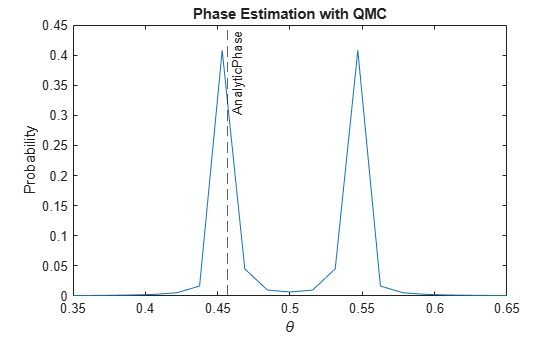
Quantum Computing is a new technology that enables complex problems to be simulated or solved, orders of magnitude faster than traditional techniques. For obvious reasons, there are some benefits to be gained for users developing financial applications. For context, there are 2 sides to Quantum, hardware and algorithms. On the hardware side, there are companies looking to develop new computers with chips that are based on Quantum Computing. On the software side, there are frameworks being developed for executing Quantum Based algorithms. MathWorks is focusing on the latter with MATLAB with the release of the MATLAB support package for Quantum Computing in R2023a.
The Finance team has been busy working on new examples thatshow how to use the functions available in the support package and apply them to the following workflows:
- Portfolio Optimization and Stock Selection
- Quantum Monte Carlo Simulation (Will be published soon)
Summary
As shown above, MathWorks has been working on and releasing a wide range of tools for professionals in the financial industry, from econometric modeling and risk management to ESG and climate finance, and even AI and quantum computing. I hope this overview has been informative and look forward to providing more insights in upcoming blog posts.


Comments
To leave a comment, please click here to sign in to your MathWorks Account or create a new one.