
Refining Macroeconomic Forecasting with MATLAB Techniques
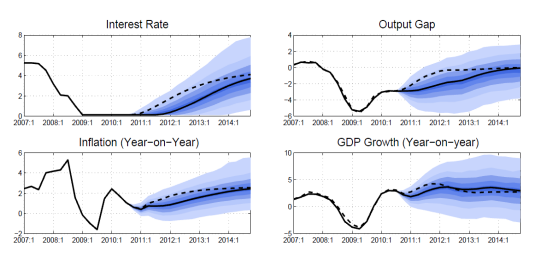
Nonlinear confidence bands help you quantify forecast uncertainty in DSGE models, but they can be slow to compute. At the MathWorks Finance Conference, Kadir Tanyeri (International Monetary Fund) showed a MATLAB workflow that cut simulations from more than 100,000 to about 3,600 and reduced runtime from months to overnight.
Why Confidence Bands Matter
Macroeconomic projections—such as GDP, inflation, and unemployment—are meaningful only when paired with an understanding of their uncertainty.
- Quantify uncertainty around baseline projections
- Estimate recession and deflation probabilities
- Compare upside and downside risks across scenarios
These measures support risk-aware decision-making in policy environments
The Challenge: Nonlinear Models and High‑Dimensional Simulation
Nonlinear dynamic stochastic general equilibrium (DSGE) models require extensive simulations to generate statistically reliable confidence bands. Traditional Monte Carlo methods often demand hundreds of thousands of simulations, which becomes impractical for high-dimensional problems involving:
- Many shocks
- Multiple forecast periods
- Large state-space
To address these challenges, Tanyeri built an end-to-end workflow in MATLAB that integrates data handling, model solution, and simulation at scale.
A MATLAB Based Workflow for Nonlinear Forecasting
Efficient Model Development and Data Preparation
Tanyeri designed and implemented a nonlinear macroeconomic model directly in MATLAB. All data preparation and transformation steps were automated to run each time the model executes.
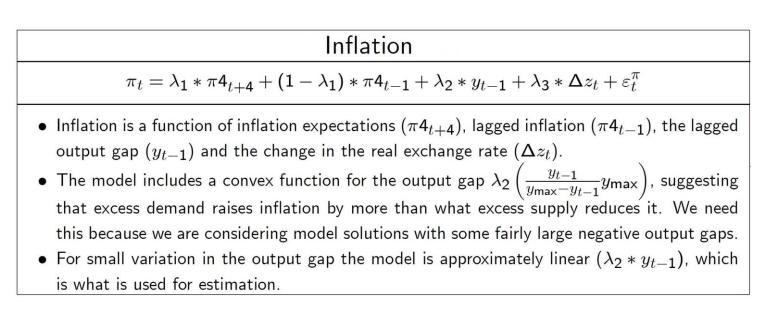
A key feature of the model is a nonlinear inflation block that captures asymmetries in how output gaps affect inflation. For example, the model allows positive output gaps to exert a stronger influence on inflation than negative gaps of a similar magnitude.
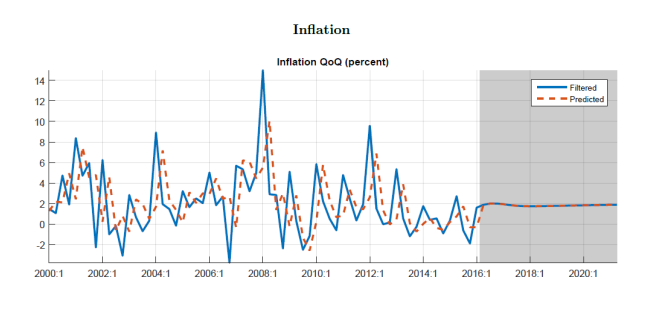
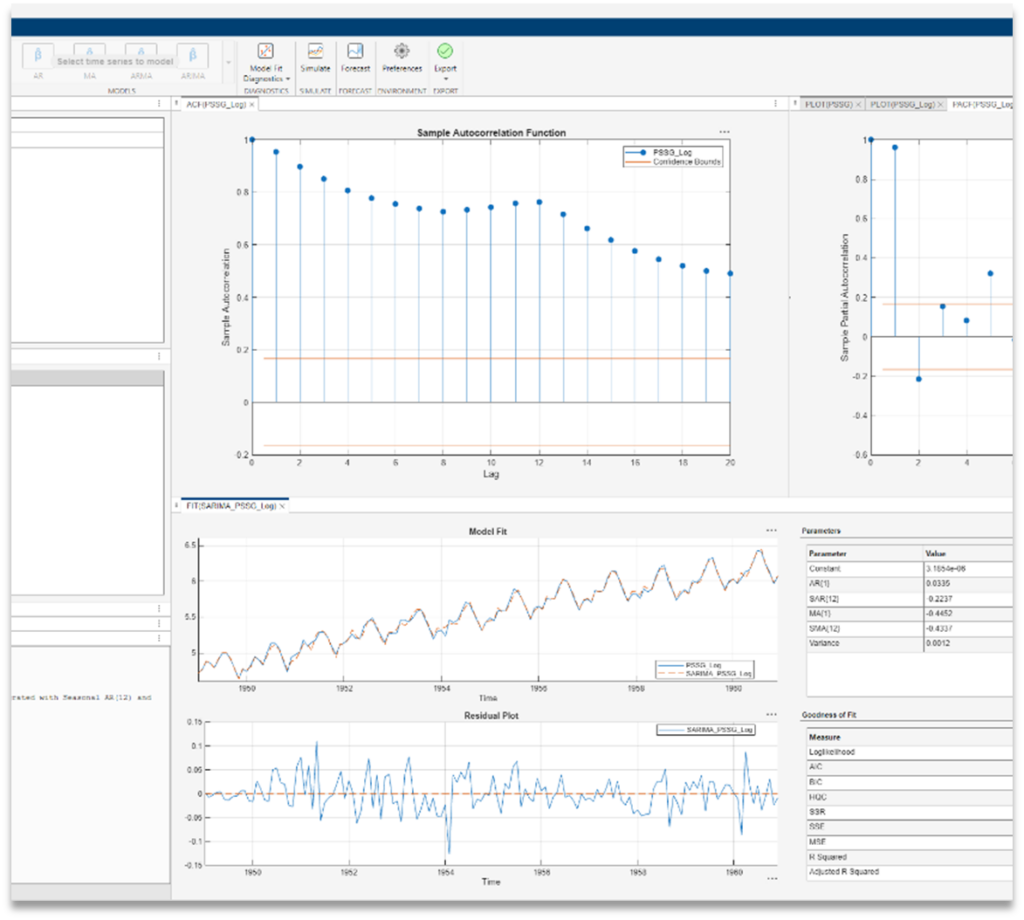
Solving the Model and Establishing the Baseline Forecast
The workflow includes parameter estimation, filtering noisy data, and generating a baseline forecast inside the MATLAB modeling environment.
Advanced Sampling: Latin Hypercube Sampling for Faster Convergence
To reduce simulation burden, Tanyeri used Latin hypercube sampling, a structured method that:
- Covers high-dimensional shock spaces more evenly
- Achieves faster convergence
- Requires far fewer draws than standard Monte Carlo methods
In his example:
- The example used 20 periods and 84 shocks, or 1,680 dimensions.
- The workflow reduced simulations from more than 100,000 to about 3,600.
This reduction is significant for large macroeconomic workloads.
Scaling Up with Distributed Computing
To make the full workflow feasible on tight timelines, Tanyeri deployed Parallel Computing Toolbox with a distributed cluster:
- 4 servers,
- 32 cores each
- 128 total workers
In Tanyeri’s workflow, the configuration reduced runtime from months to an overnight process.
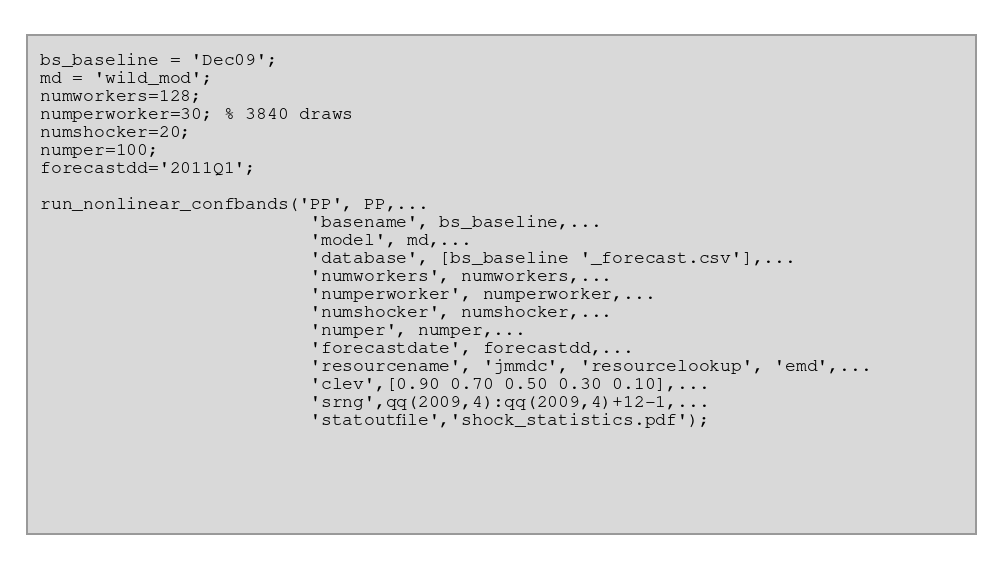
In practice, the entire confidence‑band computation can be executed through a single function call, with parameters defining the model, number of workers, number of simulations, and output structure.
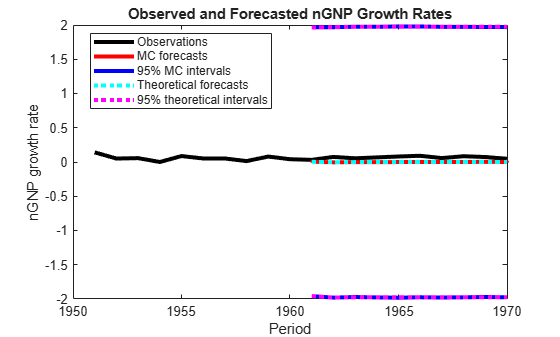
Practical Results
The workflow yields:
- Robust confidence bands for key macroeconomic variables
- Streamlined and more reliable forecast pipelines
- Clear statistics on recession and deflation probabilities
These results show how economists can use MATLAB to support rigorous, large-scale macroeconomic analysis.
Learn More
- Explore how to build and analyze DSGE models in MATLAB
- Learn more about time series regression techniques for macroeconomic forecasting
- Speed up Monte Carlo and DSGE model simulation using Parallel Computing Toolbox


评论
要发表评论,请点击 此处 登录到您的 MathWorks 帐户或创建一个新帐户。