Time stamping plots
For many of our customers the graph that gets produced at the end of a script is their entire output that will be printed and saved. That one plot must have all the relevant information on it. This is where PLTSTMP comes in handy. It is a simple way of adding a note to the bottom of your plot that shows when the plot was made and by what script. This is very nice for traceability of results.
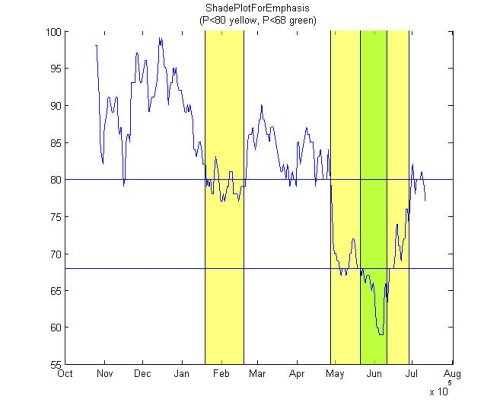
I like this entry because the help is well written, there is a simple example, and the entry has a screen capture so it is easy to see what you are getting. These things take only a little more effort on the part of the author, but make the code much better for the user.


コメント
コメントを残すには、ここ をクリックして MathWorks アカウントにサインインするか新しい MathWorks アカウントを作成します。