Plot Google Map
Jiro's pick this week is plot_google_map by Zohar Bar-Yehuda.
This pick comes from Chad's response to Brett's post. He says, "plot_google_map is not only cool, it’s also very easy to use and incredibly useful for plotting spatial data." I played around with this entry and I agree. It's very easy to use; you simply call the function, and it overlays a map on the current axes based on the latitude and longitude ranges. The part that I really like is the auto-refresh behavior, which automatically refreshes the map when I zoom into the map.
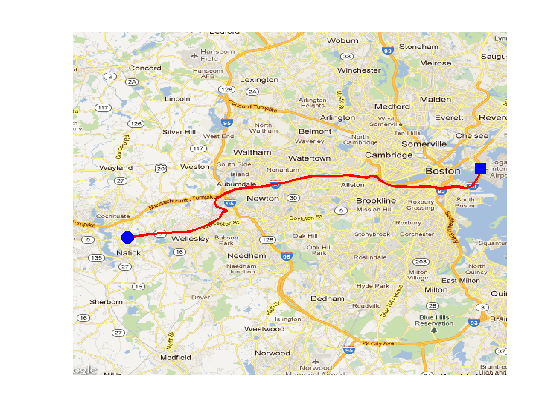
Here's the driving route from our headquarter (Natick, MA) to Boston Logan Airport. You should run this and try zooming into the map. Download the data here.
% load route data
load NatickToBOS

% plot route data
plot(Data001(:, 1), Data001(:, 2), 'r', 'LineWidth', 2);
line(Data001(1, 1), Data001(1, 2), 'Marker', 'o', ...
    'Color', 'b', 'MarkerFaceColor', 'b', 'MarkerSize', 10);
line(Data001(end, 1), Data001(end, 2), 'Marker', 's', ...
    'Color', 'b', 'MarkerFaceColor', 'b', 'MarkerSize', 10);
xlim([-71.4, -71]); axis equal off

% Google map
plot_google_map('maptype', 'roadmap');

One suggestion I have is to add the auto-refresh behavior for panning, in addition to zooming. It's very simple to do that. There's a section in the code that implements this for the zoom action:
zoomHandle = zoom;
set(zoomHandle, 'ActionPostCallback', @update_google_map);
You can do the same thing for the pan action like this:
panHandle = pan;
set(panHandle, 'ActionPostCallback', @update_google_map);
With this, if you pan the map, the graphics will update after releasing the mouse.
Thanks Zohar for the entry and Chad for the recommendation!
Comments
Give this a try and let us know what you think here or leave a comment for Zohar.
- カテゴリ:
- Picks


コメント
コメントを残すには、ここ をクリックして MathWorks アカウントにサインインするか新しい MathWorks アカウントを作成します。