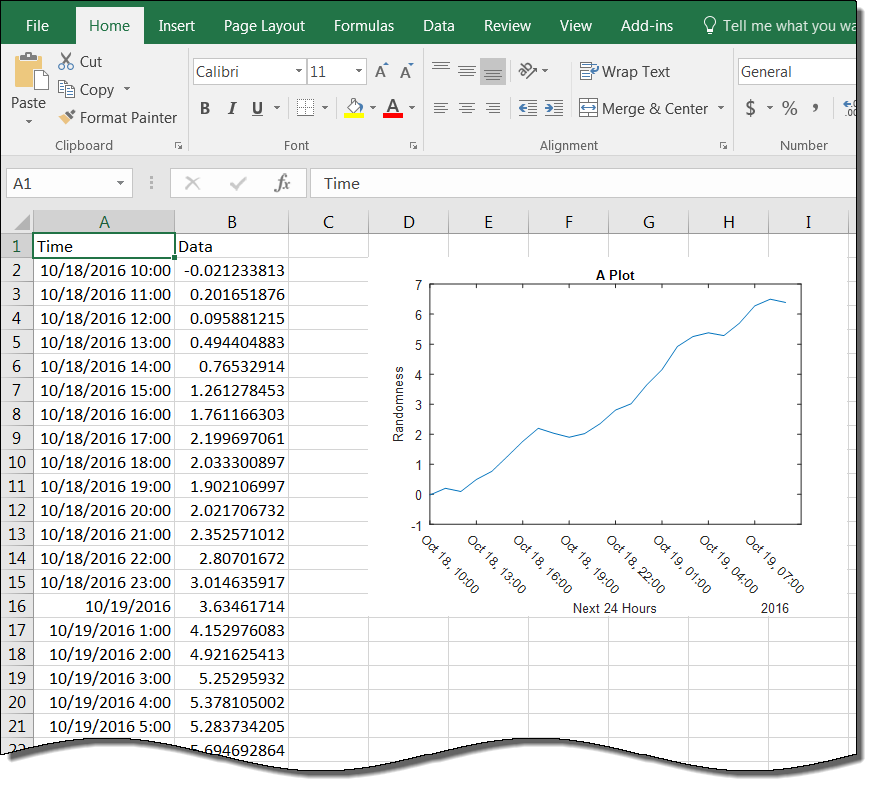
Write Your Figures to Excel
Sean‘s pick this week is xlswritefig by Michelle Hirsch.
One of my colleagues approached me earlier this week and asked me to help her with an Excel report that I’d created a few
months back. When I first created this report, I just did it manually thinking it was a one time thing. But, she wanted
to create the same report many times.
My first question was: Does it have to be Excel or could I create Word or PowerPoint reports instead? I didn’t know her end
goal for the reports so figured it would be easier to automate reporting for those formats with MATLAB Report Generator. However, Excel was a requirement.
There were some data from a table and a few figures that needed to be written and fortunately no other formatting, e.g.
conditional formatting. The table was easy; a simple call to writetable sufficed.
But how to export a figure? I didn’t want to deal with the Excel API myself, so I went to the File Exchange and searched
for “figure to Excel”. There were a few results, but Michelle’s xlswritefig seemed to have the most options and it worked on first try!
Here’s some random data for next 24 hours.
nexthour = dateshift(datetime('now'), 'end', 'hour');
Time = (nexthour:hours(1):(datetime('now')+hours(24))).';
Data = cumsum(rand(size(Time)) - 0.2);
Plot the data. Note that the convenience functions xticks and xtickangle along with many others are new in R2016b!
plot(Time, Data)
xticks(Time(1:3:end))
xtickangle(-45)
xlabel('Next 24 Hours')
ylabel('Randomness')
title('A Plot')

Write to Excel.
writetable(table(Time, Data), 'Results.xlsx', 'WriteVariableNames', true)
xlswritefig(gcf, 'Results.xlsx', 'Sheet1', 'D2')

Comments
Does creating formatted reports from MATLAB interest you? If so, what would you like to do?
Give it a try and let us know what you think here or leave a comment for Michelle.
Published with MATLAB® R2016b
- カテゴリ:
- Picks


コメント
コメントを残すには、ここ をクリックして MathWorks アカウントにサインインするか新しい MathWorks アカウントを作成します。