Almost-connected-component labeling
In a recent post I demonstrated the use of bwdist (binary image Euclidean distance transform) to perform isotropic dilation. This was inspired by something that Brett asked me about.
Last night Brett posted a comment explaining a little bit more about what he was doing. I'm going to coin a term for what Brett described: almost-connected-component labeling.
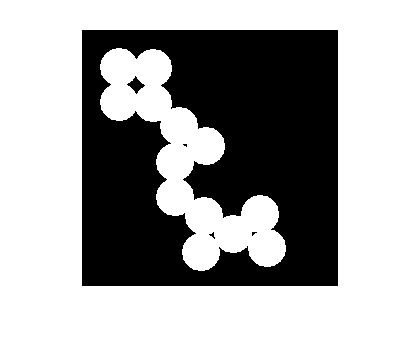
I'll illustrate with a simple synthetic image containing a number of circular blobs.
url = 'https://blogs.mathworks.com/images/steve/2010/blobs_in_clumps.png';
bw = imread(url);
imshow(bw)
Now let's label the connected components in bw.
cc = bwconncomp(bw)
cc =

    Connectivity: 8
       ImageSize: [337 313]
      NumObjects: 23
    PixelIdxList: {1x23 cell}
You can see that there are 23 distinct objects detected. The function label2rgb is useful for visualizing connected components. You use it by converting the output of bwconncomp to a label matrix using labelmatrix and then passing the result to label2rgb.
L = labelmatrix(cc);
rgb = label2rgb(L, 'jet', [.7 .7 .7], 'shuffle');
imshow(rgb)

Brett's question was this: How can we label and measure the three clumps instead of the smaller circles? (The clumps were cell clusters in Brett's problem.) The answer is to combine an isotropic dilation step with connected component labeling.
Let's say that two circles are "almost connected" if they are within 25 pixel units of distance from each other. So start with an isotropic dilation step:
bw2 = bwdist(bw) <= 12.5;
imshow(bw2)

Now we can perform connected component labeling on bw2:
L2 = labelmatrix(bwconncomp(bw2));
rgb2 = label2rgb(L2, 'jet', [.7 .7 .7], 'shuffle');
imshow(rgb2)

We have the three clumps now, but they are too "fat." That is, they have too many pixels in them because of the isotropic dilation step. So if, for example, we measure the area of each clump using regionprops:
s = regionprops(L2, 'Area');
[s.Area]
ans =

       14418       11023        6341
we get a distorted area measurement. What if we want to perform measurements only on the pixels in the original clumps?
A nice application of logical indexing will modify L2 to get rid of the added pixels. The following line sets to 0 all elements of L2 corresponding to background pixels in bw.
L2(~bw) = 0;
imshow(label2rgb(L2, 'jet', [.7 .7 .7], 'shuffle'))

s = regionprops(L2, 'Area');
[s.Area]
ans =

        4827        3510        2208
Do you have an application for "almost-connected-component labeling"? Post your comment here.
PS. Hey, in case you didn't notice, the R2010b release is out. I'll post something about it soon.


评论
要发表评论,请点击 此处 登录到您的 MathWorks 帐户或创建一个新帐户。