 Cleve’s Corner: Cleve Moler on Mathematics and Computing
 The MATLAB Blog
 Guy on Simulink
 MATLAB Community
 Artificial Intelligence
 Developer Zone
 Stuart’s MATLAB Videos
 Behind the Headlines
 File Exchange Pick of the Week
 Hans on IoT
 Student Lounge
 MATLAB ユーザーコミュニティー
 Startups, Accelerators, & Entrepreneurs
 Autonomous Systems
 Quantitative Finance
 MATLAB Graphics and App Building
More on segmenting in a*-b* space
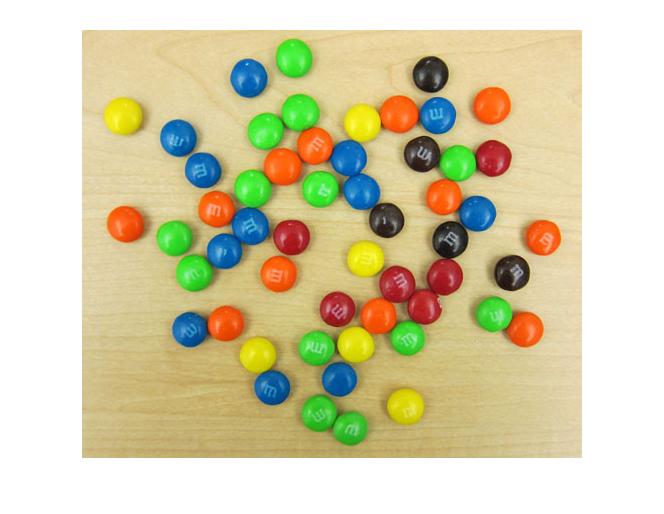
I'm back to looking at M&Ms today. (Previous posts: 17-Dec-2010, 23-Dec-2010, 30-Dec-2010, 11-Jan-2011)
url = 'https://blogs.mathworks.com/images/steve/2010/mms.jpg';
rgb = imread(url);
imshow(rgb)
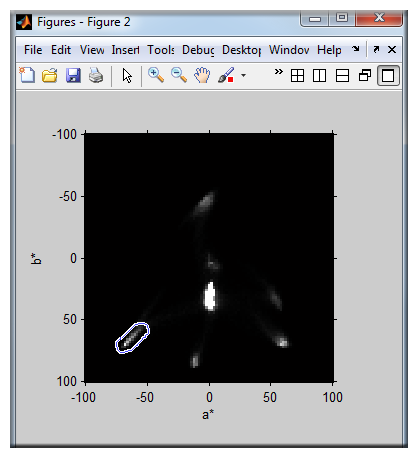
Last time I showed how I used imfreehand to segment the region in the a*-b* plane corresponding to the green M&Ms.
This time I'll use connected-components labeling and regionprops to segment the image based on all the colors, including the desk background.
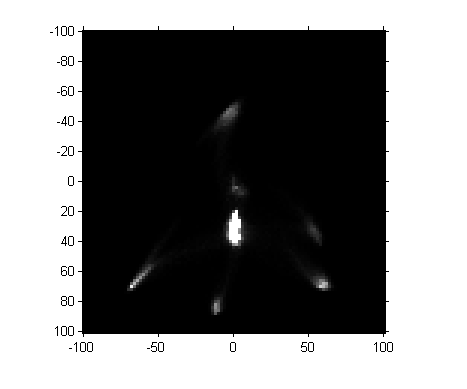
I saved the previously computed a*-b* histogram in a MAT-file online; here's how to retrieve and display it.
matfile_url = 'https://blogs.mathworks.com/images/steve/2011/freehand_segment.mat';
temp_matfile = [tempname '.mat'];
urlwrite(matfile_url, temp_matfile);
s = load(temp_matfile);
delete(temp_matfile)
H = s.H;
imshow(H, [0 1000], 'InitialMagnification', 300, 'XData', [-100 100], ...
    'YData', [-100 100])
axis on
Next, let's threshold the image. (Magic Number Alert! I chose the threshold manually based on visual inspection of pixel values.)
mask = H > 100;
imshow(mask, 'InitialMagnification', 300, 'XData', [-100 100], ...
    'YData', [-100 100])
axis on
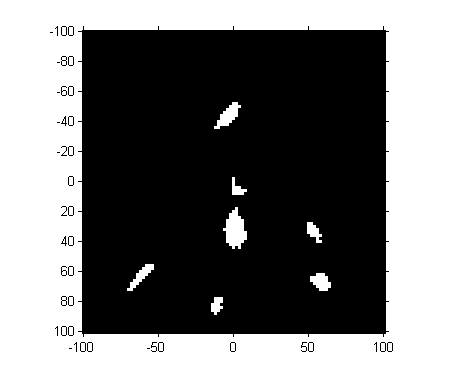
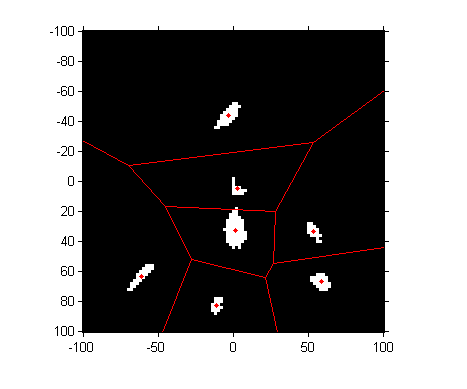
So we've got seven "blobs". Let's measure their centroids.
props = regionprops(mask, s.H, 'Centroid');
props(1)
ans =

    Centroid: [20.2143 82.5357]
centers = cat(1, props.Centroid)
centers =

   20.2143   82.5357
   45.4706   92.2353
   49.2973   29.0541
   51.6029   67.1765
   52.2667   53.4667
   77.8000   67.8000
   80.1724   84.4483
These centroid values are in the intrinsic pixel coordinates of the image. To convert them to a* and b* values, we have to scale and shift.
ab_centers = 2*centers - 102
ab_centers =

  -61.5714   63.0714
  -11.0588   82.4706
   -3.4054  -43.8919
    1.2059   32.3529
    2.5333    4.9333
   53.6000   33.6000
   58.3448   66.8966
a_centers = ab_centers(:,1);
b_centers = ab_centers(:,2);
Next question: where are these centers, and what are the regions in the a*-b* plane closest to each one? The voronoi function shows you both.
hold on
voronoi(a_centers, b_centers, 'r')
hold off
To perform a nearest-neighbor classification of all the pixels, let's compute the Delaunay triangulation, from which we can easily do the nearest-neighbor calculation.
dt = DelaunayTri(a_centers, b_centers)
dt =

  DelaunayTri

  Properties:
      Constraints: []
                X: [7x2 double]
    Triangulation: [7x3 double]
Compute the a* and b* values of all the pixels:
lab = lab2double(applycform(rgb, makecform('srgb2lab')));
L = lab(:,:,1);
a = lab(:,:,2);
b = lab(:,:,3);
For every pixel in the original image, find the closest a*-b* centroid by using the nearestNeighbor function with the Delaunay triangulation.
X = nearestNeighbor(dt, a(:), b(:));
X = reshape(X, size(a));
I would like to make a colormap of the seven colors in our segmentation. We have a* and b* values for each of the colors, but not L* values. We could just make up a constant L* value. Instead, I'll compute the mean L* value for all the pixels closest to the centroid of each of the histogram blobs.
L_mean = zeros(size(a_centers));
for k = 1:numel(L_mean)
    L_mean(k) = mean(L(X == k));
end
Now we convert the L*a*b* values corresponding to each of our seven colors back to RGB using applycform.
map = applycform([L_mean, a_centers, b_centers], makecform('lab2srgb'))
map =

    0.2587    0.8349    0.1934
    0.8724    0.8465    0.0271
    0.1095    0.4111    0.6803
    0.8382    0.7591    0.5286
    0.3304    0.2993    0.2751
    0.7264    0.2055    0.2008
    0.9653    0.3595    0.0690
And finally we can use X and map to display our segmented result as an indexed image.
close all
imshow(X, map)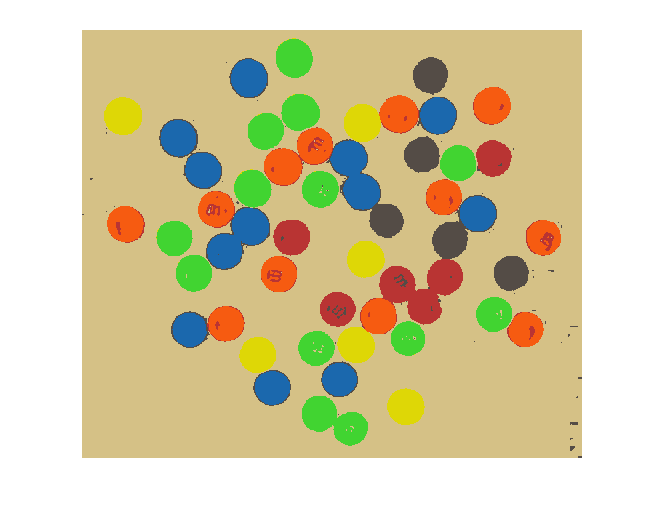
Not bad!
Unless I have some inspiration between now and next week, I might be ready to let this image go and search for something else to write about.


评论
要发表评论,请点击 此处 登录到您的 MathWorks 帐户或创建一个新帐户。