Five years ago: January and February 2006
It's hard for me to believe, but I started writing this blog just over five years ago. I'm going to start occasionally recapping old blog posts, especially those with content that is still useful today and that more recent readers may not have seen.
In January 2006 I showed how to generate useful test images with some simple mathematical computations.
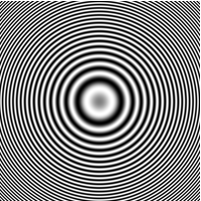
I also highlighted the MATLAB "publish" feature. This capability lets you easily publish simple MATLAB scripts as HTML, Word, PDF, LaTeX, and other types of documents. Command Window output and generated figures are captured automatically into the output. I use "publish" to write almost all of my blog posts.
I had just read Steve Squyres' book Roving Mars: Spirit, Opportunity, and the Exploration of the Red Planet, and I summarized its description of DIMES, the Descent Image Motion Estimation System. I didn't discover until later how MathWorks products had been used in the design of this and other Mars Exploration Rover systems. (See the June 2004 issue of MATLAB News and Notes.)
I started a long-running series of posts on the spatial (or geometric) transformation of images.
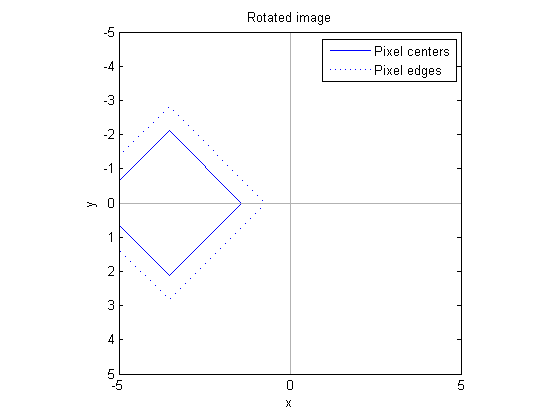
And I started another series of posts to explain all the different ways in which array values can get turned into image pixel colors on the screen. In 2006 we edited this series into a MATLAB Digest article called "How MATLAB Represents Pixel Colors."
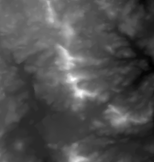
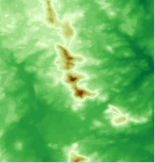
In February 2006 I continued my two series on spatial transformations and pixel colors. (Later on I learned not to start two series at the same time.)

I described how developers often don't understand how long it takes for our users to become familiar with new features in the product. Partially this is because the "developer calendar" is shifted quite a lot from the user's experience. By the time the earliest downloaders of R2011a had installed that release, we were wrapping up feature work for R2011b and were well into planning for R2012a.
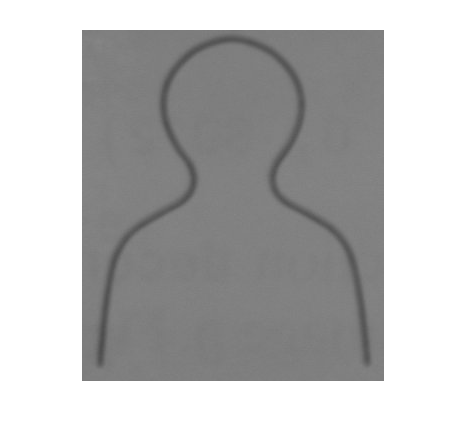
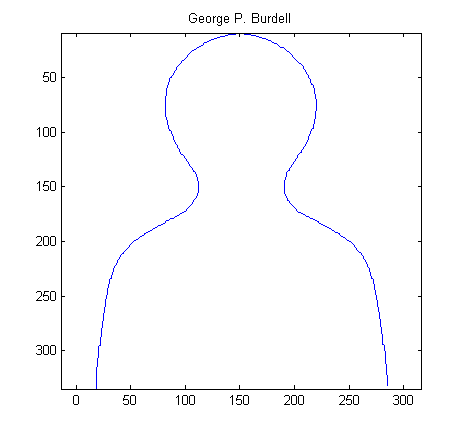
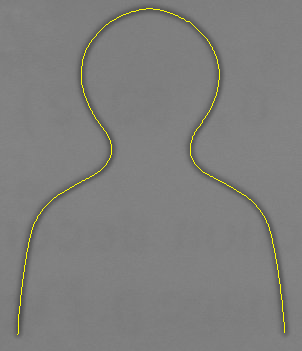
Finally, I exposed the limits of my artistic ability with the post called "Tracing George." (George is a person that all Georgia Tech students and alums know fondly.) This post demonstrated thresholding, morphological thinning, and boundary tracing.




评论
要发表评论,请点击 此处 登录到您的 MathWorks 帐户或创建一个新帐户。