Starting a Radon transform visualizer
Today I set out to write a post called "Radon transform - under the hood."
Things didn't turn out the way I expected.
When I considered how to write the post I originally intended, I started thinking about how it would be nice to have a good way to visualize (and therefore help understand) the Radon transform itself. So I started working on that instead.
Of course, I didn't have a lot of time today, so I didn't get anywhere near finished with a working app. But I thought I would post anyway!
I'm inviting you, dear reader, to weigh in about what you think would make a good Radon transform visualizer.
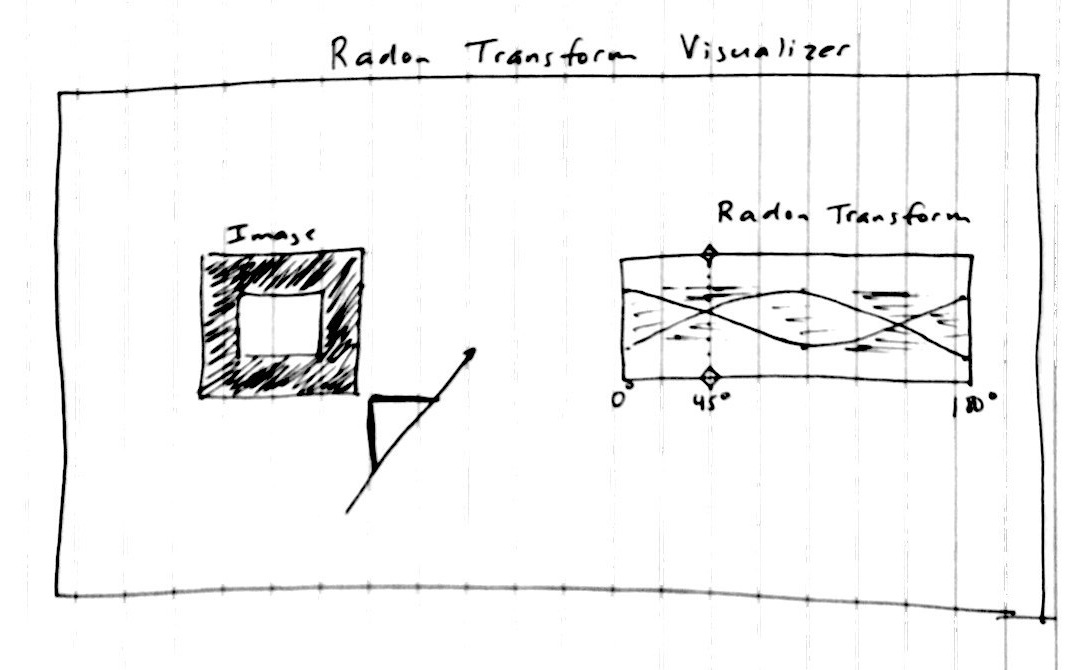
To get you started, here's my sketch:

On the left, you can see a simple image (light square on dark background), and you can see the Radon projection along one particular angle (45 degrees).
On the right, you can see the entire Radon transform, displayed as an image. You can also see a vertical dashed line at 45 degrees, which corresponds to the projection angle shown on the left.
I imagine you could interactively drag either the projection axis on the left or the vertical line on the right to change the projection angle and watch the projection change.
So, what do you think? Good idea, bad idea? Any suggestions?


コメント
コメントを残すには、ここ をクリックして MathWorks アカウントにサインインするか新しい MathWorks アカウントを作成します。