How to Read and Visualize a DICOM Volume
Earlier this year, I learned something about DICOM datasets that surprised me. I had downloaded a Head-Neck CT+PET study, and I wanted to create a volume array in MATLAB. I tried to do this the hard way at first, and of course I got it wrong. (Spoiler: there's an easy way.)
I naively assumed that there was some meaning to the order of filenames in the DICOM dataset. Here is the folder I was looking at:

You can see that I had files of the form 00000.dcm, 00001.dcm, ..., 000089.dcm. So, I read these files in filename order and concatenated the data in the third dimension. And, I got a mess. I had assumed that the filename order corresponded to physical slice order, but I was wrong.
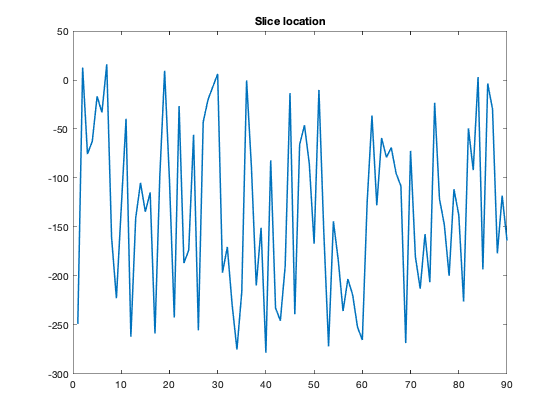
You can see this by looking at the SliceLocation field returned by dicominfo. Let me read the files in filename order and plot the resulting slice locations.
folder = "/Users/eddins/OneDrive - MathWorks/General Reference/D/DICOM Head-Neck-PET-CT Dataset/HN-CHUM-001/08-27-1885-PANC. avec C.A. SPHRE ORL   tte et cou  -TP-74220/3-StandardFull-07232";
d = dir(folder + "/*.dcm");
for k = 1:length(d)
    info = dicominfo(folder + "/" + d(k).name);
    slice_location(k) = info.SliceLocation;
end
plot(slice_location)
title('Slice location')

Uh oh. That's not good. Does that even make sense, I wondered? Are these all unique slice locations? Let me try sorting them, first, and then plotting them.
plot(sort(slice_location))
title('Sorted slice locations')

That's more like what I expected. But it means that my assumption about the filenames was completely off.
But wait! As I said, I was doing this the hard way. The easy way is to use the function dicomreadVolume, which uses the DICOM metadata to automatically figures out how to arrange the slices in the output volume.
[V,sp] = dicomreadVolume(folder);
whos V
  Name        Size                     Bytes  Class    Attributes

  V         512x512x1x90            47185920  int16
The size of the third dimension is 1 (we call that a singleton dimension) because the voxels do not have multiple color components. We can use squeeze to get rid of it.
V = squeeze(V);
whos V
  Name        Size                   Bytes  Class    Attributes

  V         512x512x90            47185920  int16
The second output of dicomreadVolume contains spatial information about the voxels.
sp
sp =

  struct with fields:

       PatientPositions: [90×3 double]
          PixelSpacings: [90×2 double]
    PatientOrientations: [2×3×90 double]
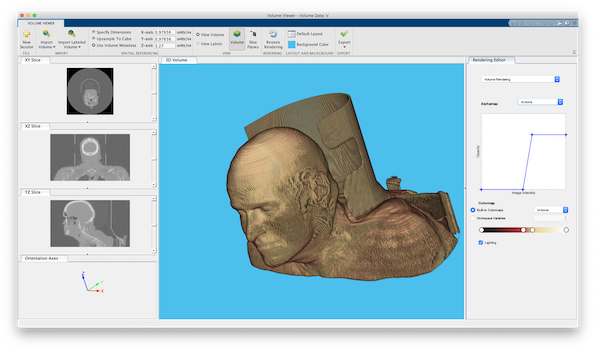
I like to use Volume Viewer (volumeViewer) to figure out the best ways to visualize a volume.
volumeViewer(V)
It is helpful to use the spatial information returned by dicomreadVolume for Volume Viewer.
slice_location = sort(slice_location);
scale_factors = [sp.PixelSpacings(1,:) slice_location(2)-slice_location(1)];
volumeViewer(V,'ScaleFactors',scale_factors)
Here's a Volume Viewer screen shot with this data:

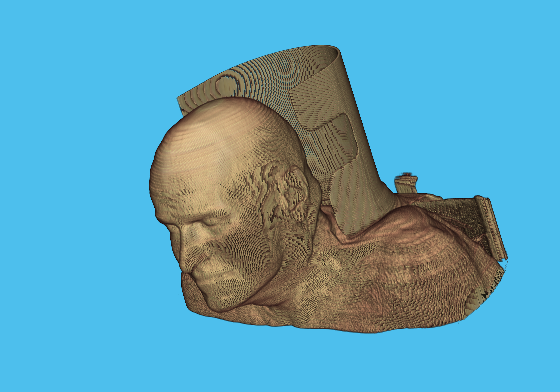
From the Volume Viewer, you can save rendering and camera configuration information to a struct that you can pass to volshow, which displays the volume visualization in ordinary figure window. You still have to pass in the scale factors as a separate argument.
volshow(V,config,'ScaleFactors',scale_factors);

Do you work with DICOM volume data in MATLAB? Let us know in the comments what you would like to see.
Data credits
- Cancer Imaging Archive: Clark K, Vendt B, Smith K, et al. The Cancer Imaging Archive (TCIA): Maintaining and Operating a Public Information Repository. Journal of Digital Imaging. 2013; 26(6): 1045-1057. doi: 10.1007/s10278-013-9622-7.
- Head-Neck-PET-CT collection: Vallières, M. et al. Radiomics strategies for risk assessment of tumour failure in head-and-neck cancer. Sci Rep 7, 10117 (2017). doi: 10.1038/s41598-017-10371-5
- Subject ID: HN-CHUM-001


Comments
To leave a comment, please click here to sign in to your MathWorks Account or create a new one.