Weather Forecasting in MATLAB for the WiDS Datathon 2023
In today’s blog, Grace Woolson gives us an insight into how you can get started with using Machine Learning and MATLAB for Weather Forecasting to take on the WiDS Datathon 2023 challenge. Over to you Grace..
Introduction
Today, I’m going to show an example of how you can use MATLAB for the WiDS Datathon 2023. This year’s challenge tasks participants with creating a model that can predict long-term temperature forecasts, which can help communities adapt to extreme weather events often caused by climate change. WiDS participants will submit their forecasts on Kaggle. This tutorial will walk through the following steps of the model-making process:
- Importing a Tabular Dataset
- Preprocessing Data
- Training and Evaluating a Machine Learning Model
- Making New Predictions and Exporting Predictions
MathWorks is happy to support participants of the Women in Data Science Datathon 2023 by providing complimentary MATLAB licenses, tutorials, workshops, and additional resources. To request complimentary licenses for you and your teammates, go to this MathWorks site, click the “Request Software” button, and fill out the software request form.
To register for the competition and access the dataset, go to the Kaggle page, sign-in or register for an account, and click the ‘Join Competition’ button. By accepting the rules for the competition, you will be able to download the challenge datasets available on the ‘Data’ tab.
Import Data
First, we need to bring the training data into the MATLAB workspace. For this tutorial, I will be using a subset of the overall challenge dataset, so the files shown below will differ from the ones you are provided. The datasets I will be using are:
- Training data (train.xlsx)
- Testing data (test.xlsx)
The data is in tabular form, so we can use the readtable function to import the data.
trainingData = readtable(‘train.xlsx’, ‘VariableNamingRule’, ‘preserve’);
testingData = readtable(‘test.xlsx’, ‘VariableNamingRule’, ‘preserve’);
Since the tables are so large, we don’t want to show the whole dataset at once, because it will take up the entire screen! Let’s use the head function to display the top 8 rows of the tables, so we can get a sense of what data we are working with.
head(trainingData)
head(testingData)
Now we can see the names of all of the columns (also known as variables) and get a sense of their datatypes, which will make it much easier to work with these tables. Notice that both datasets have the same variable names. If you look through all of the variable names, you’ll see one called ‘tmp2m’ – this is the column we will be training a model to predict, also called the response variable.
It is important to have a training and testing set with known outputs, so you can see how well your model performs on unseen data. In this case, it is split ahead of time, but you may need to split your training set manually. For example, if you have one dataset in a 100,000-row table called ‘train_data’, the example code below would randomly split this table into 80% training and 20% testing data. These percentages are relatively standard when distributing training and testing data, but you may want to try out different values when making your datasets!
[trainInd, ~, testInd] = dividerand(100000, .8, 0, .2);
trainingData = train_data(trainInd, :);
testingData = train_data(testInd, :);
Preprocess Data
Now that the data is in the workspace, we need to take some steps to clean and format it so it can be used to train a machine learning model. We can use the summary function to see the datatype and statistical information about each variable:
summary(trainingData)
This shows that all variables are doubles except for the ‘start_time’ variable, which is a datetime, and is not compatible with many machine learning algorithms. Let’s break this up into three separate predictors that may be more helpful when training our algorithms:
trainingData.Day = trainingData.start_date.Day;
trainingData.Month = trainingData.start_date.Month;
trainingData.Year = trainingData.start_date.Year;
trainingData.start_date = [];
I’m also going to move the ‘tmp2m’ variable to the end, which will make it easier to distinguish that this is the variable we want to predict.
trainingData = movevars(trainingData, “tmp2m”, “After”, “Year”);
head(trainingData)
Repeat these steps for the testing data:
testingData.Day = testingData.start_date.Day;
testingData.Month = testingData.start_date.Month;
testingData.Year = testingData.start_date.Year;
testingData.start_date = [];
testingData = movevars(testingData, “tmp2m”, “After”, “Year”);
head(testingData)
Now, the data is ready to be used!
Train & Evaluate a Model
There are many different ways to approach this year’s problem, so it’s important to try out different models! In this tutorial, we will be using a machine learning approach to tackle the problem of weather forecasting, and since the response variable ‘tmp2m’ is a number, we will need to create a regression model. Let’s start by opening the Regression Learner app, which will allow us to rapidly prototype several different models.
regressionLearner
When you first open the app, you’ll need to click on the “New Session” button in the top left corner. Set the “Data Set Variable” to ‘trainingData’, and it will automatically select the correct response variable. This is because it is the last variable in the table. Then, since this is a pretty big dataset, I change the validation scheme to “Holdout Validation”, and set the percentage held out to 15. I chose these as starting values, but you may want to play around with the Validation Scheme when making your own model.
After we’ve clicked “Start Session”, the Regression Learner App interface will load.
Step 1: Start A New Session
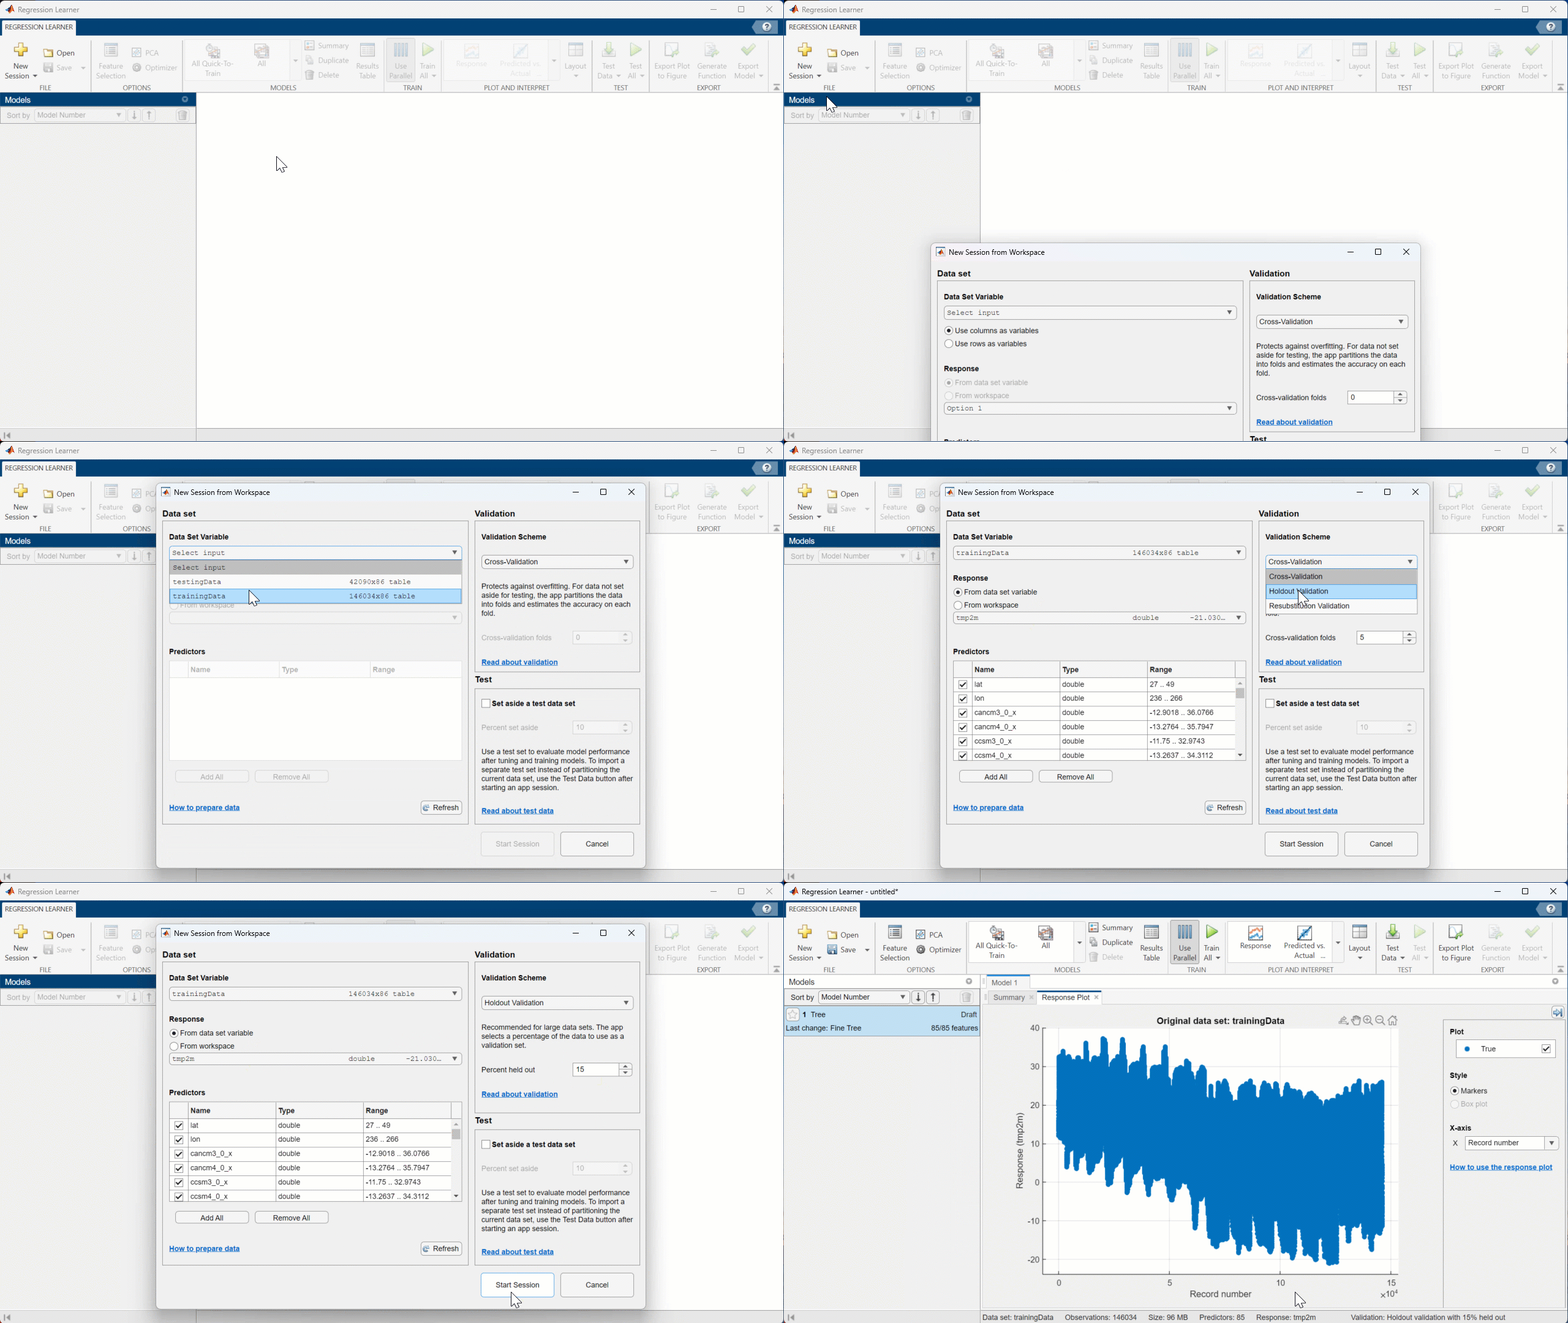
[Click on “New Session” > “From Workspace”, set the “Data Set Variable” to ‘trainingData’, set the “Validation Scheme” to ‘Holdout Validation’, set “percent held out” to 15, click “Start Session”]
From here, I’m going to choose to train “All Quick-to-Train” model options, so I can see which one performs the best out of these few. The steps for doing this are shown below. Note: this recording is slightly sped up since the training will take several seconds.
Step 2: Train Models
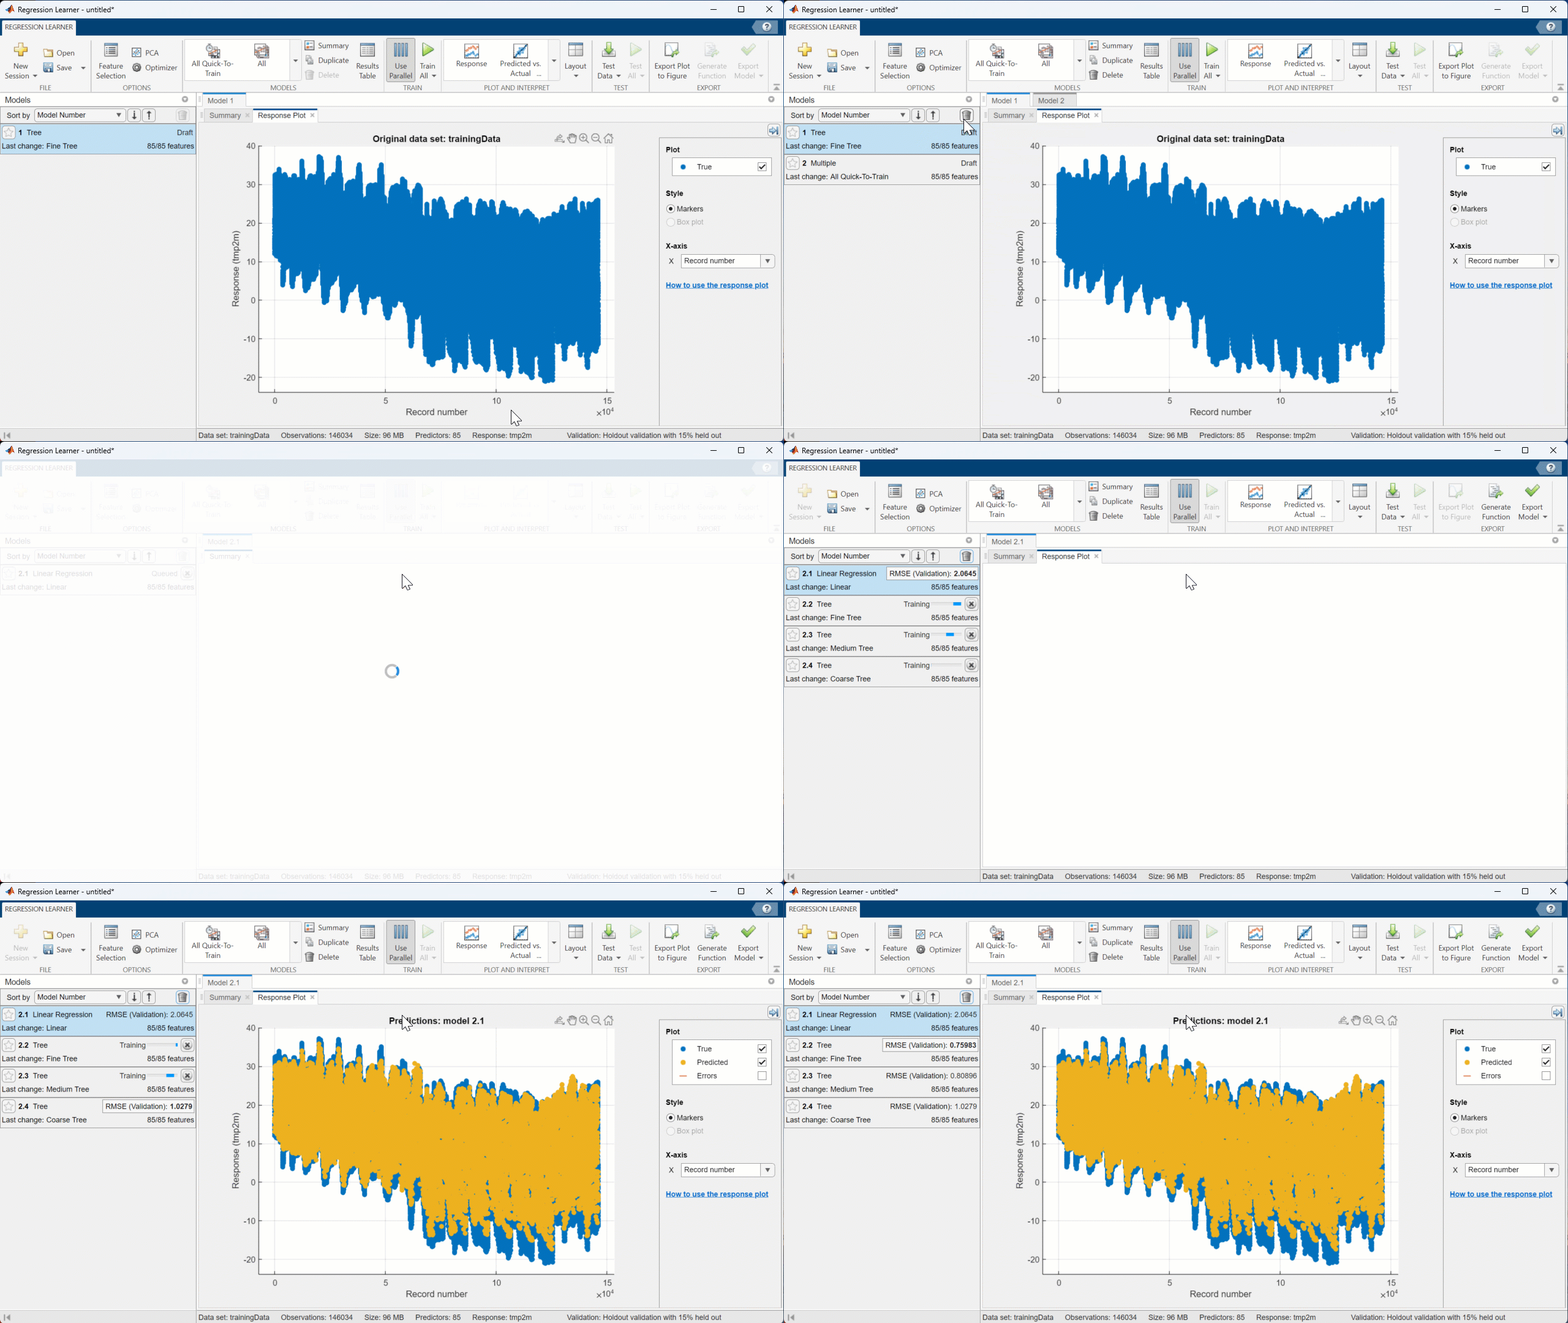
[Click “All Quick-To-Train” in the MODELS section of the Toolstrip, delete the “1. Tree” model in the “Models” panel, click “Train All”, wait for all models to finish training]
I chose the “All Quick-to-Train” option so that I could show the process, but if you have the time, you may want to try selecting “All” instead of the “All Quick-to-Train” option. This will give you more models to work with.
Once those have finished training, you’ll see the RMSE, or Root-Mean-Squared-Error values, shown on the left hand side. This is a common error metric for regression models, and is what will be used to evaluate your submissions for the competition. RMSE is calculated using the following equation:

This value tells you how well the model performed on the validation data. In this case, the Fine Tree model performed the best!
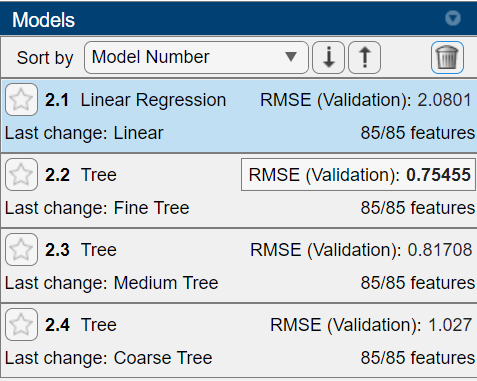
The Regression Learner app also lets you import test data to see how well the trained models perform on new data. This will give you an idea on how accurate the model may be when making your final predictions for the competition test set. Let’s import our ‘testingData’ table, and see how these models peform.
Step 3: Evaluate Models with Testing Data
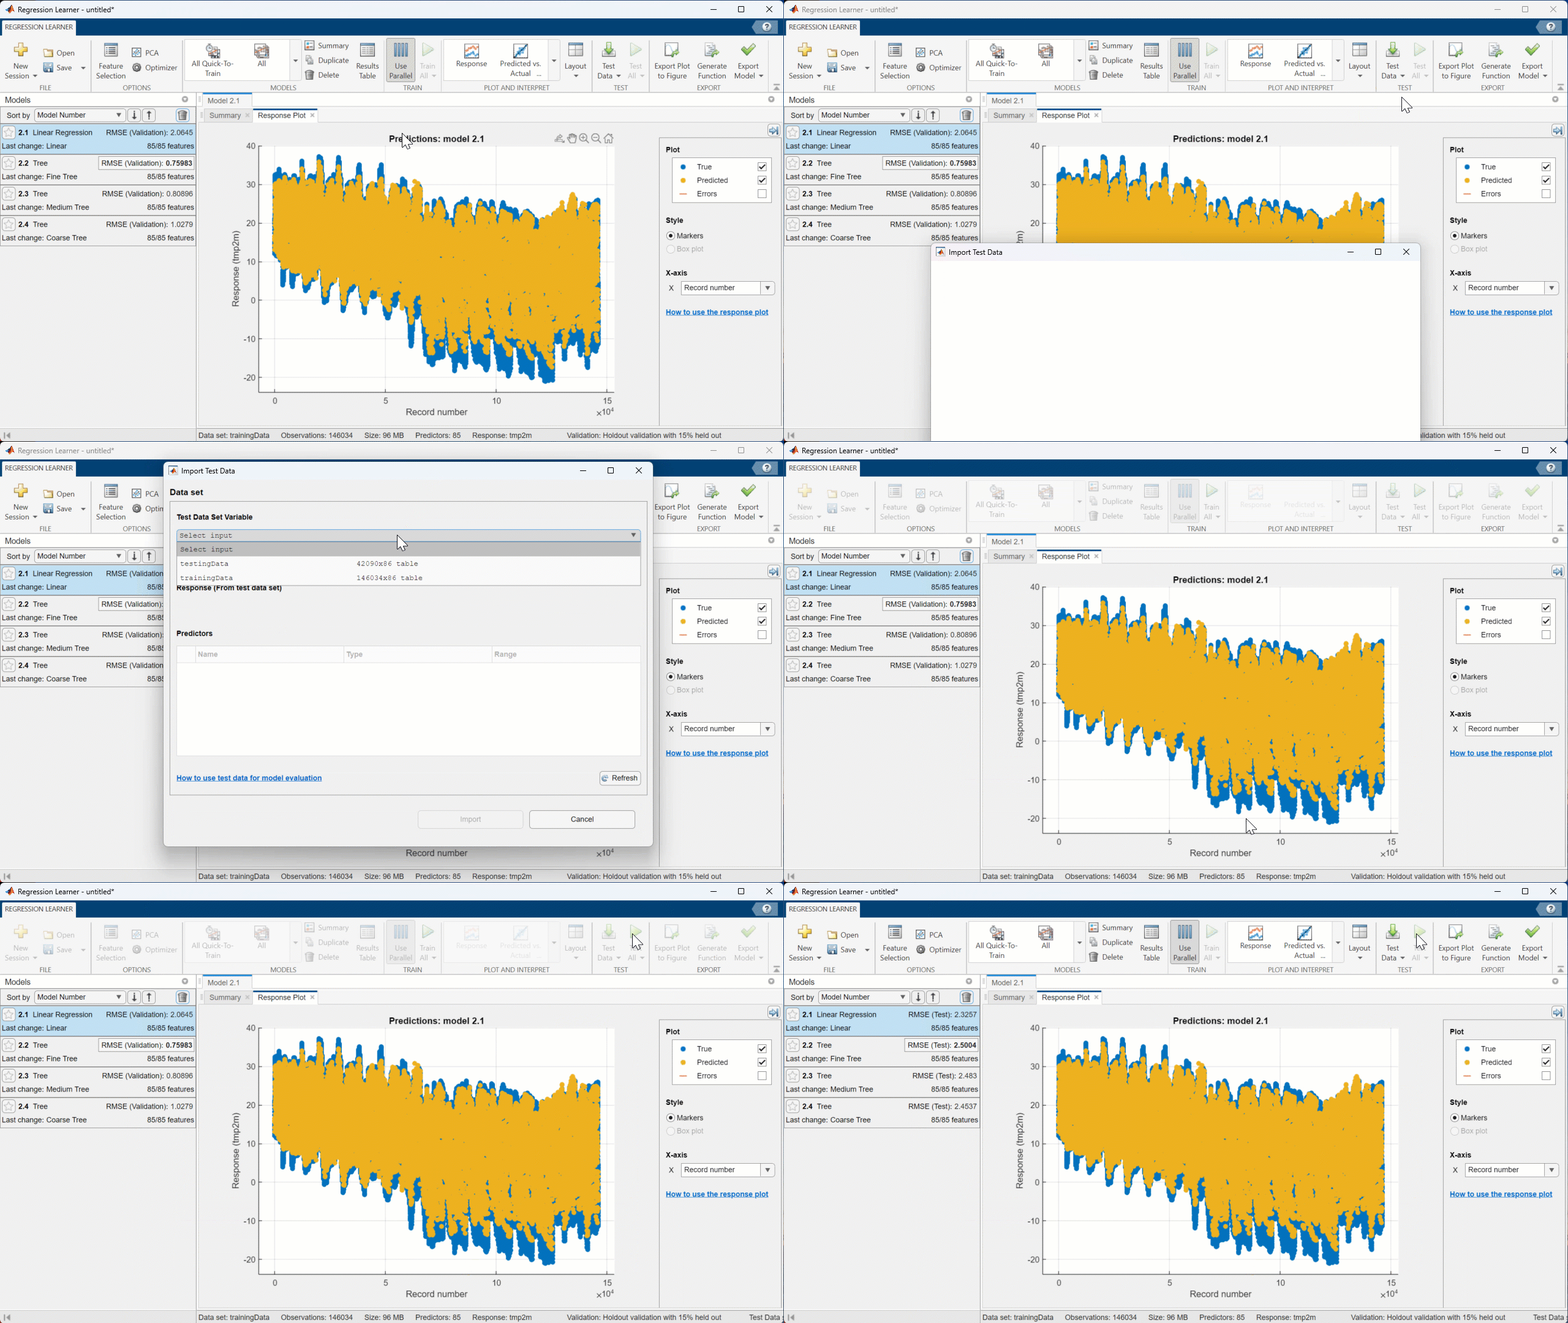
[Click on the “Test Data” dropdown, select “From Workspace”. In the window that opens, set “Test Data Set Variable” to ‘testingData’, then click “Import”. Click “Test All” – new RMSE values will be calculated]
This will take a few seconds to run, but once it finishes we can see that even though the Fine Tree model performed best on the validation data, the Linear Regression model performs best on completely new data.

You can also use the ‘PLOT AND INTERPRET’ tab of the Regression Learner app to create visuals that show how the model performed on the test and validation sets. For example, let’s look at the “Predicted vs. Actual (Test)” graph for the Linear Regression model:
Step 4: Plot Results
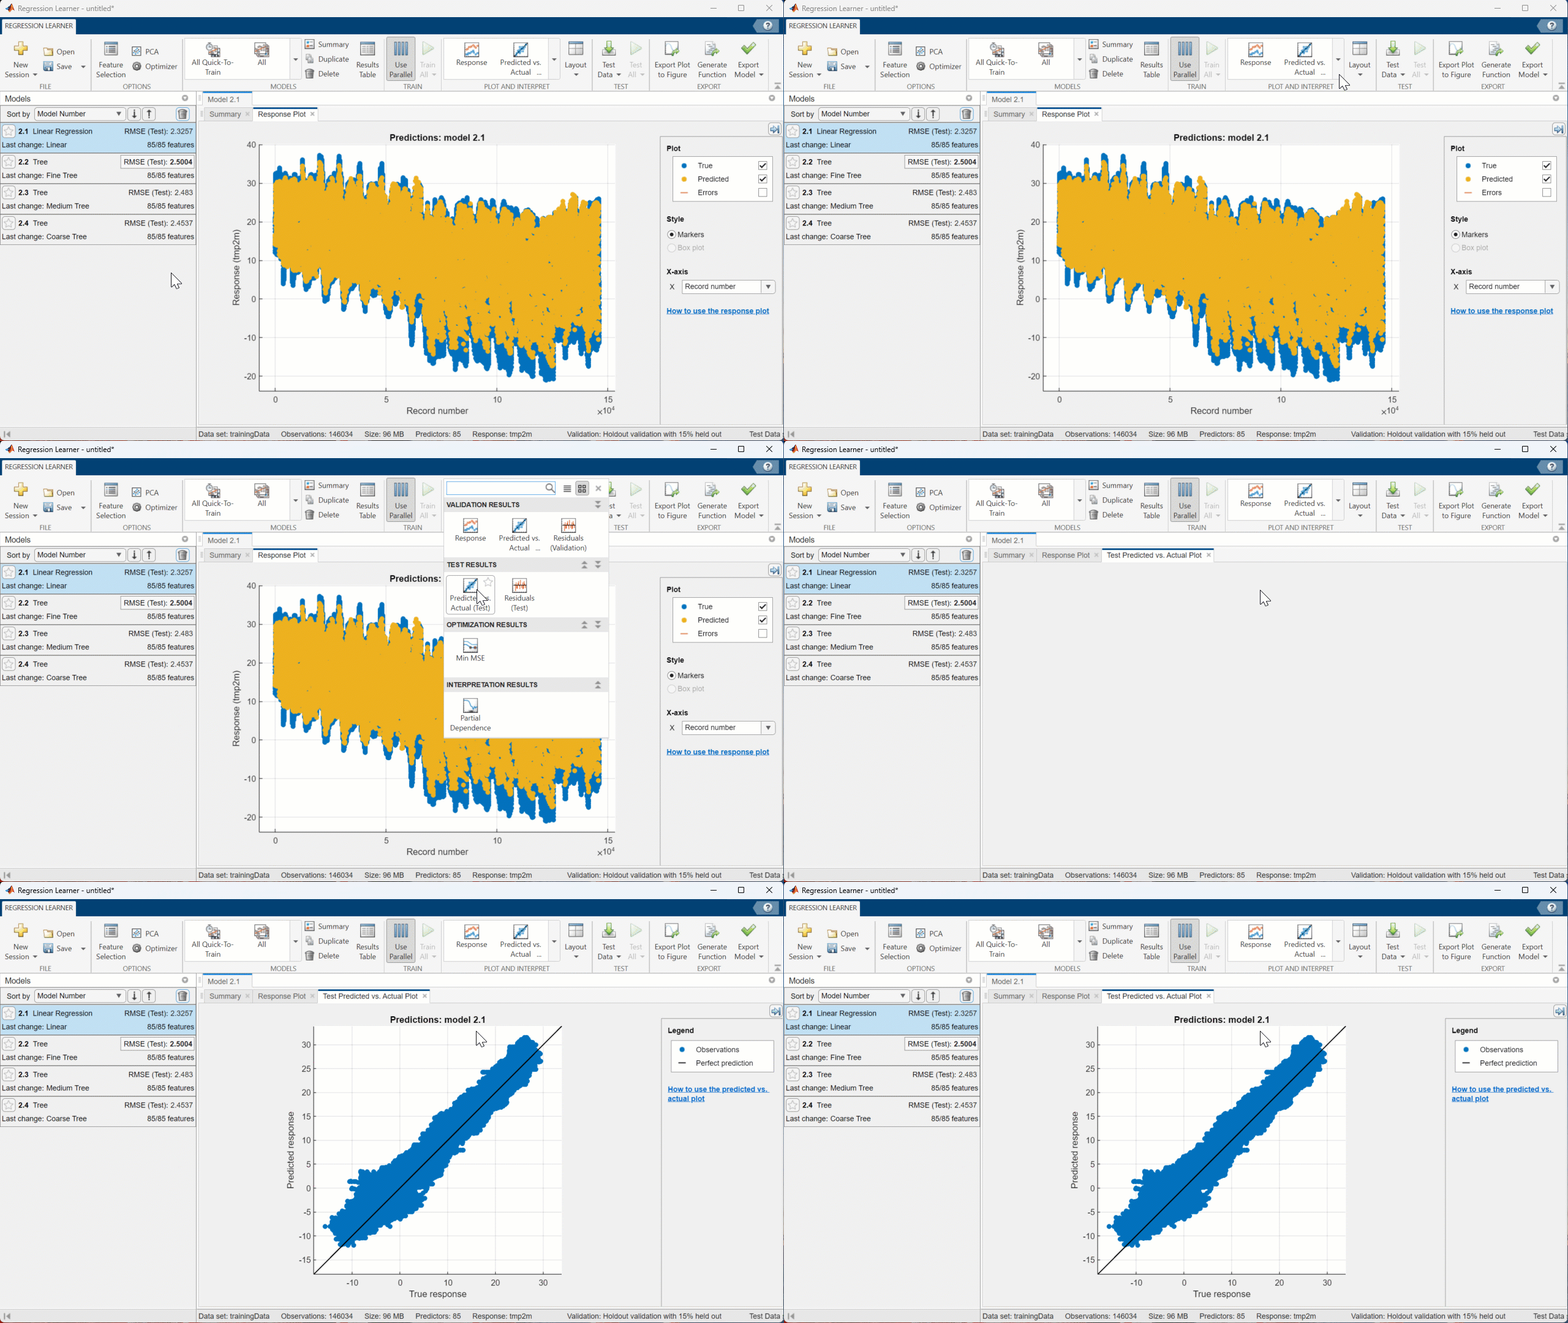
[Click on the drop-down menu in the PLOT AND INTERPRET section of the Toolstrip, then select “Predicted vs. Actual (Test)”]
Since this model performed relatively well, the blue dots (representing the predictions) stay pretty close to the line (representing the actual values). I’m happy with how well this model performs, so lets export it to the workspace so we can make predictions on other datasets!
Step 5: Export the Model
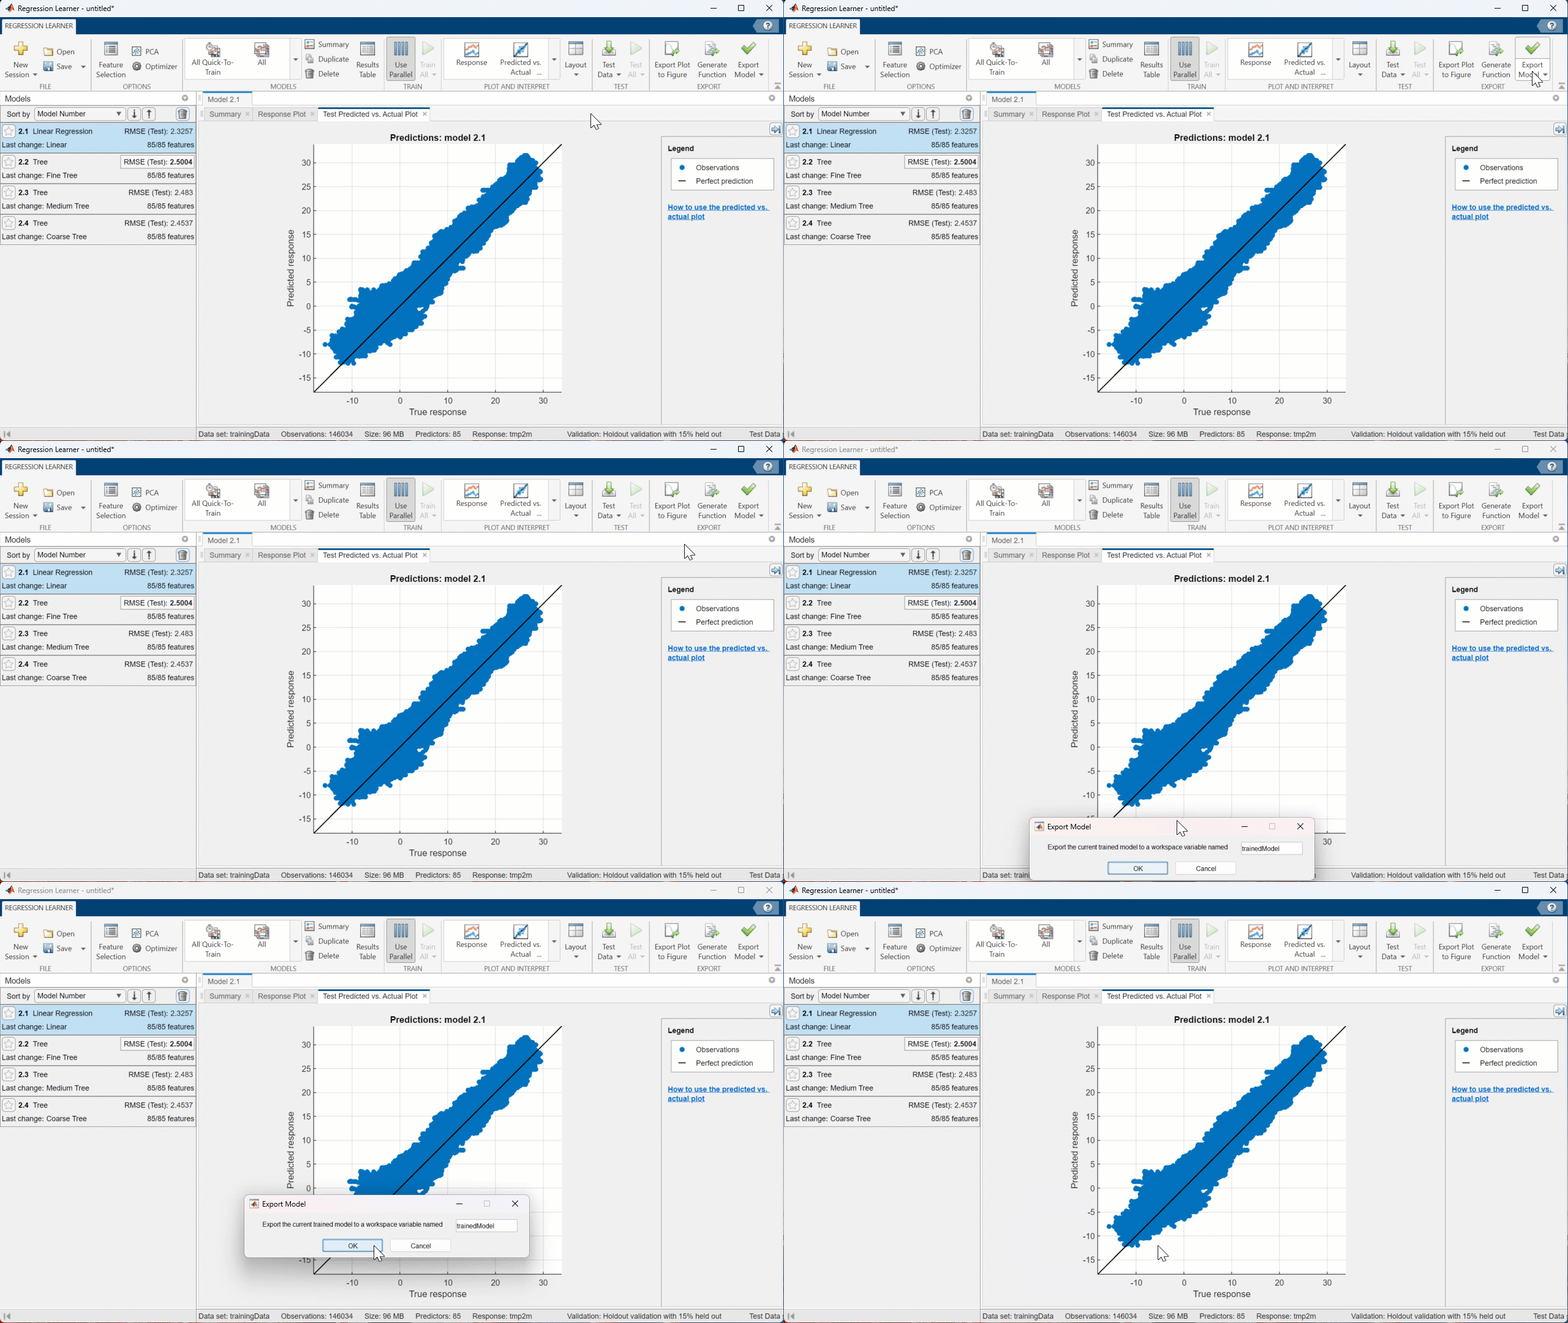
[In the EXPORT section of the Toolstrip, click “Export Model” > “Export Model”. In the window that appears, click “OK”]
Now the model is in the MATLAB Workspace as “trainedModel” so I can use it outside of the app.
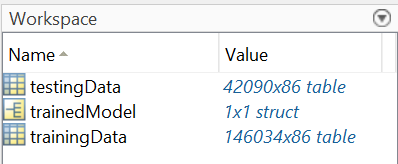
To learn more about exporting models from the Regression Learner app, check out this documentation page!
Save and Export Predictions
Once you have a model that you are happy with, it’s time to make predictions on new data. To show you what this workflow looks like, I’m going to remove the “tmp2m” variable from my testing dataset, because the competition test set will not have this variable.
testingData = removevars(testingData, “tmp2m”);
Now we have a dataset that contains the same variables as our training set except for the response variable. To make predictions on this dataset, use predictFcn:
tmp2m = trainedModel.predictFcn(testingData);
This returns an array containing one prediction per row of the test set. To prepare these predictions for submission, we’ll need to create a table with two columns: one containing the index number, and one containing the prediction for that index number. Since the dataset I am using does not provide an index number, I will create an array with index numbers to show you what the resulting table will look like.
index = (1:length(tmp2m))’;
outputTable = table(index, tmp2m);
head(outputTable)
Then we can export the results to an excel sheet to be read and used by others!
writetable(outputTable, “datathonSubmission.csv”);
To learn more about submission and evaluation for the competition, refer to the Kaggle page.
Experiment!
When creating any kind of AI model, it’s important to test out different workflows to see which one performs best for your dataset and challenge! This tutorial was only meant to be an introduction, but there are so many other choices you can make when preprocessing your data or creating your models. There is no one algorithm that suits all problems, so set aside some time to test out different models. Here are some suggestions on how to get started:
- Try other preprocessing techniques, such as normalizing the data or creating new variables
- Play around with the training options available in the app
- Change the variables that you use to train the model
- Try machine and deep learning workflows
- Change the breakdown of training, testing, and validaton data
If you are training a deep learning network, you can also utilize the Experiment Manager to train the network under different conditions and compare the results!
Done!
Thank you for joining me on this tutorial! We are excited to find out how you will take what you have learned to create your own models. I recommend looking at the ‘Additional Resources’ section below for more ideas on how you can improve your models.
Feel free to reach out to us at studentcompetitions@mathworks.com if you have any further questions.
Additional Resources
- Overview of Supervised Learning (Video)
- Preprocessing Data Documentation
- Missing Data in MATLAB
- Supervised Learning Workflow and Algorithms
- Train Regression Models in Regression Learner App
- Train Classification Models in Classiication Learner App
- 8 MATLAB Cheat Sheets for Data Science
- MATLAB Onramp
- Machine Learning Onramp
- Deep Learning Onramp


评论
要发表评论,请点击 此处 登录到您的 MathWorks 帐户或创建一个新帐户。