How to Detect an X-Rite® ColorChecker® Chart
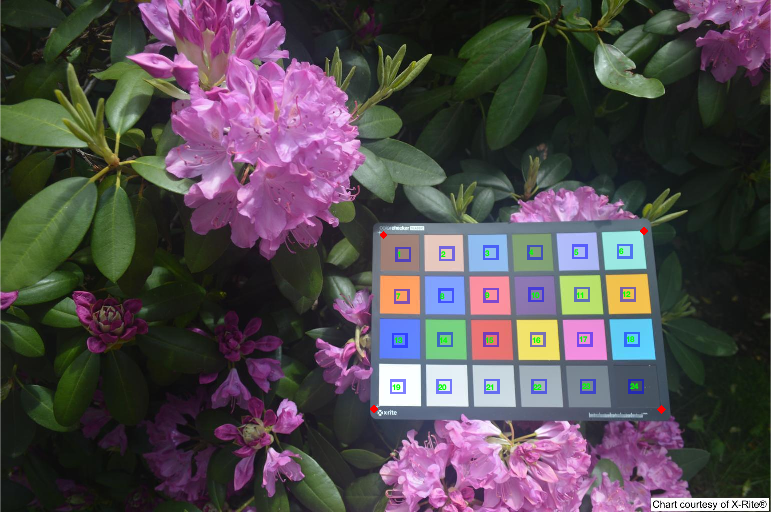
When I saw this picture, I was really tempted to take it into the local garden nursery and ask them how to keep color checker charts out of my rhododendrons.

No, no, this post is not really about protecting gardens against unusual invaders. I was looking over the just-released R2020b Image Processing Toolbox, and I noticed that a number of color science related features made it into the release. Since I was posting about color a couple of months ago, I thought I would highlight some of these new features here. Today, I'll start with a function that can detect the location of an X-Rite® ColorChecker® chart into the workspace.
First, let's read our test image. This file contains the image shown above.
A = imread('colorCheckerTestImage-with-credit.jpg');
Next, create a colorChecker object from the image.
chart = colorChecker(A)
chart =

  colorChecker with properties:

                 Image: [1024×1541×3 uint8]
    RegistrationPoints: [4×2 double]
             ColorROIs: [24×1 struct]
When created, the colorChecker object searches to find the position of the color checker chart in the image. The optional Downsample and Sensitivity parameters control some aspects of the automatic detection.
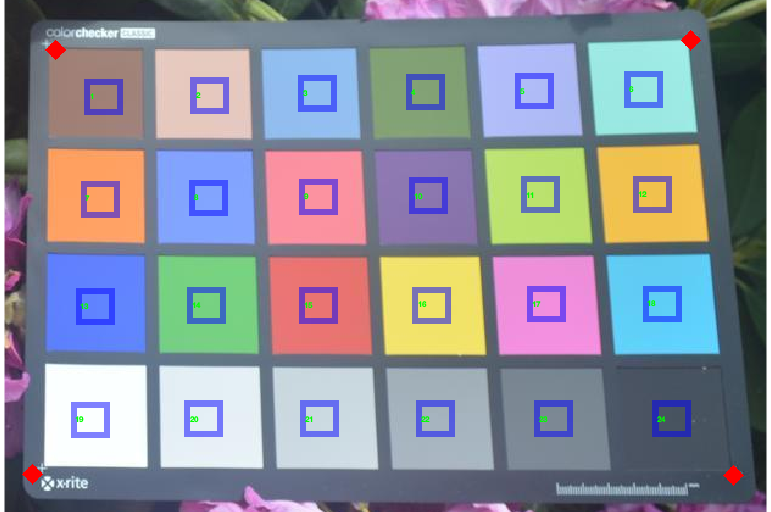
The displayChart function shows the image and places markers and numbers to identify the detected chart corners (called "registration points") and numbered color squares.
displayChart(chart)

axis([725 1350 430 850])

The measureColor function produces a table containing the measured values of the detected color chart squares, together with their reference values. It also includes $\Delta_E$, a measure of perceptual color difference.
T = measureColor(chart)
T =

  24×9 table

    ROI         Color          Measured_R    Measured_G    Measured_B    Reference_L    Reference_a    Reference_b    Delta_E
    ___    ________________    __________    __________    __________    ___________    ___________    ___________    _______

     1     {'DarkSkin'    }       160           128           119           37.54          14.37          14.92       19.817
     2     {'LightSkin'   }       229           200           191           64.66          19.27           17.5       22.587
     3     {'BlueSky'     }       146           191           241           49.32          -3.82         -22.54       27.312
     4     {'Foliage'     }       130           161           117           43.46         -12.74          22.72       20.404
     5     {'BlueFlower'  }       175           187           248           54.94           9.61         -24.79       23.073
     6     {'BluishGreen' }       155           232           226           70.48         -32.26          -0.37       18.284
     7     {'Orange'      }       255           161            99           62.73          35.83           56.5       16.114
     8     {'PurplishBlue'}       130           164           254           39.43          10.75         -45.17       28.889
     9     {'ModerateRed' }       252           146           160           50.57          48.64          16.67       23.601
    10     {'Purple'      }       139           118           175            30.1          22.54         -20.87       24.672
    11     {'YellowGreen' }       187           226           110           71.77         -24.13          58.19        15.21
    12     {'OrangeYellow'}       241           193            78           71.51          18.24          67.37       13.952
    13     {'Blue'        }        96           131           255           28.37          15.42          -49.8        33.34
    14     {'Green'       }       118           209           130           54.38         -39.72          32.27       22.461
    15     {'Red'         }       234           116           114           42.43          51.05          28.62        21.87
    16     {'Yellow'      }       241           227           105            81.8           2.67          80.41       23.495
    17     {'Magenta'     }       241           143           221           50.63          51.28         -14.12       23.967
    18     {'Cyan'        }        94           206           247           49.57         -29.71         -28.32       28.558
    19     {'White'       }       251           255           255           95.19          -1.03           2.93       5.6635
    20     {'Neutral8'    }       229           239           246           81.29          -0.57           0.44       13.655
    21     {'Neutral6.5'  }       203           218           225           66.89          -0.75          -0.06       20.166
    22     {'Neutral5'    }       165           179           189           50.76          -0.13           0.14        22.69
    23     {'Neutral3.5'  }       123           136           148           35.63          -0.46          -0.48       21.844
    24     {'Black'       }        72            83            97           20.64           0.07          -0.46       16.965
Now I just need to figure out how to keep these things out of my garden.
This post was adapted from the example "Create ColorChecker Chart from Test Image" in the documentation for colorChecker.
Copyright 2020 The MathWorks, Inc.


Comments
To leave a comment, please click here to sign in to your MathWorks Account or create a new one.