
Virginia Tech AutoDrive Simulation Suite for Autonomous Vehicles
Introduction
The focus of this blog is to delve into Virginia Tech’s simulation team and show off how they leveraged MathWorks’ Simulink and MATLAB platforms to gain major insights into the development process for autonomous vehicle systems. While the team was able to use MathWorks tools in numerous ways, the simulation team leaned particularly heavily into the ability to dynamically manipulate virtual environments to replicate real driving scenarios. Below is a discussion of how the team was able to create, test, validate, and visualize the data from simulations to fuel the development of our software-driven vehicle.
Motivation
When developing software for the control of an autonomous vehicle, our goal is to develop, deploy, test, analyze, then repeat the process to progress our car closer to full autonomy. This is no easy task. Our team has learned that development takes a lot of effort from all types of sub-teams. Historically, our team has developed and tested software directly on the physical vehicle. Once learning that MathWorks was challenging us to lean more into a simulation-focused approach, we jumped in feet first. Given our established background in MATLAB, the team aimed to learn more about Simulink and how it could serve as a new means of testing our software developments. With that in mind, we set out to create a simulation test bench that could allow us to quickly yet safely deploy our code to virtual vehicles and propel our development pace to new heights.
Methodology
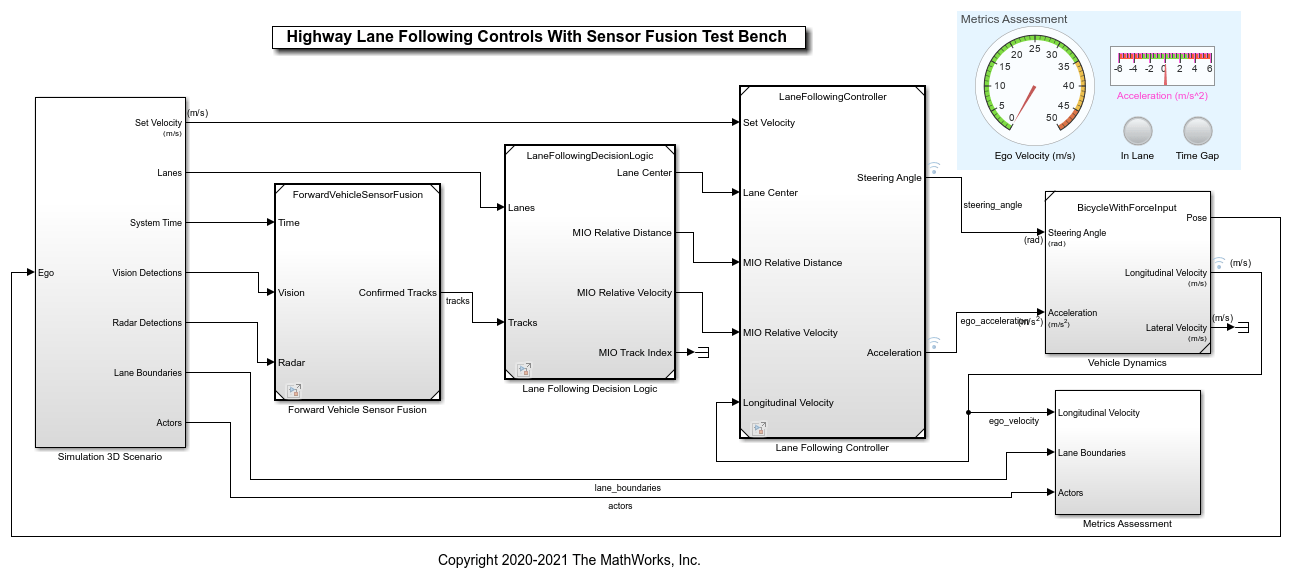
Knowing that we had been challenged to create a simulation allowing us to perform regression-type testing, we knew that developing Simulink subsystems was required. For these reasons, the team has developed a simulation environment comprised of a vehicle dynamics module, a path planning module, a CAN communication module, a global commander module, and a vehicle controller module as seen in Figure 1 below. The focus of this article will be on the vehicle controller and path planning modules as these were among the most impactful software developed entirely in the simulation environment.

Figure 1: VT simulation test-bench including path planning, 3d-visualization, a user operated vehicle, and an experimentally validated vehicle dynamics emulator.
The team was tasked to create a simulation environment where we could create and then vary specific “scenarios”. A scenario in this case refers to a situation that our simulated autonomous vehicle must navigate. We decided to create a scenario where our autonomous vehicle was driving a given path but was disturbed by another vehicle driving into its path. This requires the vehicle to handle the situation in a few different ways. In some cases, the autonomous vehicle must stop, while in others the vehicle is able to change lanes to continue toward its original destination. Figure 2 below shows a few images illustrating the scenario setup.


Figure 2: Dynamic actor routing as seen from a chase camera angle and birds-eye views
While we started by creating a scenario where all dynamic actors were controlled by predefined routes, our team eventually chose to develop a user interface which consisted of a game controller used by students to manually vary the scenarios. This served a few purposes. The first major benefit of this style of testing is that we can directly interact with the autonomous vehicle in real-time. The second major advantage is that it enables students to be more involved in the testing and analysis portions of simulation. Some of the user interface design can be seen in Figure 3 below.

Figure 3: The team’s user interface with force feedback capabilities allowing for more realistic feel when driving in the simulator.
We outlined a few requirements for the students. They must drive in as close to a legal manner as possible, they cannot hit the autonomous vehicle directly, and they must do their best to cause the autonomous vehicle to fail. With these simple rules in place, we allowed students to interact with the autonomous vehicle as much as they wanted. We recorded and analyzed data from these interactions and used the findings to fuel our development processes. The results of our testing will be outlined later. Overall, this method of allowing students to drive in the simulation allowed for more life-like scenarios. These manual scenarios were all recorded for the ability to play them back in a completely automated test bench in order for us to dive further into a scenario we found particularly interesting.

Figure 4: Students testing out and using the Simulation test bench at Virginia Tech’s O-Show event
Results and Validation
The team was able to gain meaningful information using human interactions in simulation. We captured the following three major types of data: vehicle controller data, imagery data, and regression testing parameter performance data. All three require different methods of visualizing and analyzing data. While many options exist, we settled on a custom real-time control data display, a video stream showing us what the vision systems can see along with any lane line data they produced, and finally a spider plot to compare the different metrics we deemed important for regression testing, respectively. Examples of these can be seen in Figure 5 below.


Figure 5: Three data display options used by the team to view real-time control data (top left), spider plots from regression testing (top right), and the vehicle chase camera (bottom).
The real-time control data display was used to monitor all control signals related to the autonomous vehicle throughout our testing. This display consisted of lateral errors, velocity errors, steering wheel angle inputs, and acceleration and braking inputs to name a few. Not only did this information prove useful in finding flaws in our simulation control, but it directly impacted the software developed for our real vehicle, making this analysis more valuable than any simulation testing ever done before by the VT AutoDrive team.
The ability to see what the vehicle “sees” also serves as a great way to discover shortcomings with our perception algorithms. The team was able to display and save the video feeds from the simulation which allowed us to completely redevelop our lane tracking algorithm to work far more efficiently than before. Simulink makes video processing and display far more user-friendly than any other platform we have used, which enables our ability to quickly iterate on software design and see the results in near real-time. While image processing is still being developed by our team, the tools provided to us by Simulink have propelled us forward at a much faster pace than ever before.
One of the most useful discoveries by the simulation team was spider plots as seen in Figure 6 below. These plots serve as a great method of displaying how well a given test case achieves multiple design criteria. It took the team a while to discover and use these plots, but the impact was felt immediately upon implementation. The ability to run regression testing and find the broad effects of changing one or more design variables proved very useful. We were able to find what variables are more strongly linked together, as well as determining if other variables are adequately independent. While this may not sound groundbreaking, the team was able to determine if some of our assumed control strategies were possible while simultaneously discovering which regions of operation our strategies worked best. Our team has found this data display technique so impactful, that nearly all development is now focusing on these types of data visualizations.

Figure 6: A typical display created by a set of regression tests demonstrating how multiple trials can be quickly compared using high impact parameters.
The results of our regression testing showed that when the autonomous vehicle was maneuvering through lane changes to avoid collisions with the dynamic actors, our algorithms did not control the lateral accelerations adequately. We found that in a few cases, our controller overshot the maximum allowable lateral acceleration limit by up to 8%. While doing a deeper analysis of this problem, we ended up finding that the error was caused by our steering controller. We ended up altering our steering controller to consider our speed, allowing for the accelerations limits to be kept in later testing. While this is currently the only numerically defined result, we also had other findings. We found that our communication structure allowed for read/write errors between different code blocks. Yet another set of results focused on the ability for our lane line detection algorithms to correctly identify and track lane lines local to the front of the vehicle. We found that our original lane tracking software worked nearly 95% of the time with parallel lines in front of the vehicle, but once curves and camera noise were introduced, our original algorithms failed to achieve above a 30% lane tracking ability.
Conclusion
The team was able to draw extremely helpful conclusions from the simulation challenge. The course of learning to create a simulation test bench allowed the team to venture down new paths never considered. While the need to change our controller and our findings regarding the lane line tracking both helped to fix specific problems, we are even happier that we developed a new method for software development. The ability to run our algorithms in Simulink allowed us to do far more than ever before. We were able to learn how to better set up our data communication methods to include things like ping-pong buffers, bitwise checking of runtime conditions, and internal aging counters to ensure data is fresh in the system. We also learned that using toolboxes like the vehicle communications toolbox allows us to focus our efforts more efficiently toward our problems while allowing established solutions to assist us. Finally, we learned that having the ability to flesh out how the many different code modules interact with each other is extremely valuable. We found that using subsystems within Simulink allowed us to have discussions as low- or high-level as we needed. Overall, we found out that simulation is a more powerful tool than any of us ever considered and now our team has completely swapped over to a simulation-based development approach. This approach being one where we can continually develop, deploy, test, and analyze large amounts of data. We have also developed some future goals regarding the simulation test bench. The team is currently working to create an environment where data collected from real world testing will be implemented into the simulation to not only validate, but also fuel our developments toward our fully autonomous vehicle.
- 범주:
- Automotive,
- Simulink


댓글
댓글을 남기려면 링크 를 클릭하여 MathWorks 계정에 로그인하거나 계정을 새로 만드십시오.