Skip to Main Content Skip to Search
File Exchange
MATLAB Newsgroup
Link Exchange
  Blogs  
 Contest 
MathWorks.com

Ken & Mike on the MATLAB Desktop

October 29th, 2007

Filter your help

If you are using MATLAB with a lot of toolboxes and blocksets, there is a lot of documentation available to you in the Help browser. That’s almost always a good thing, but if you’re primarily interested in just a few of your installed products the others might just be cluttering up the Help browser, making it harder for you to quickly find what you need. With the product filter, you can configure the Help browser to only show documentation from the products that you really need help for.

To set the product filter, open the Preferences dialog (File -> Preferences…) and select “Help” in the left-hand side. You can get to the help preferences quickly from the command window by running

>> preferences Help

Help browser preferences

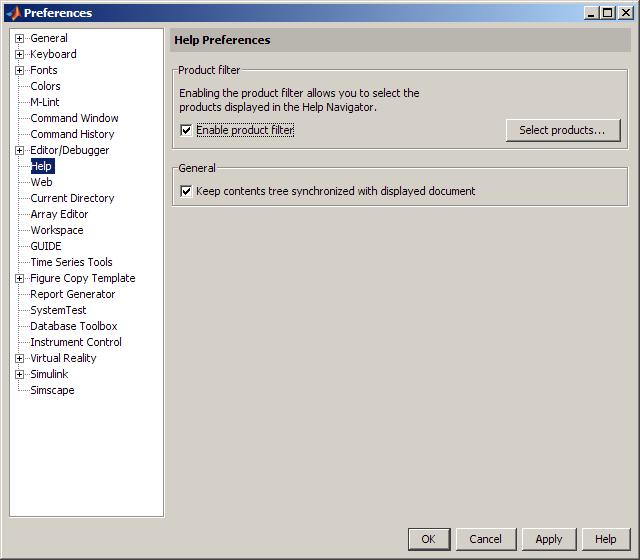
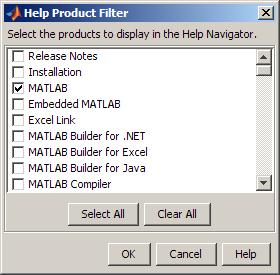
Check the box labeled “Enable product filter”, then click on the “Select products…” button to bring up the product filter dialog.

Help browser product filter

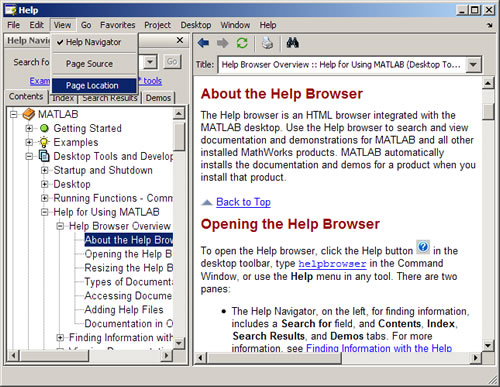
The product filter applies to the Contents, Index, Search, and Demos tabs in the Help browser, but does not apply to MATLAB commands such as help or doc. So, for example, if you have the product filter configured to hide the MATLAB documentation, you can still bring up the reference page for the MATLAB plot function by running

>> doc plot

2 Responses to “Filter your help”

  1. Ramon Bello replied on :

    Hello,

    I have a problem with Matlab not graphing a function. I have certain constants defined except I have variable “h” and a function “Ts”.

    I have this equation:
    0.13=b.*p.*A.*((Ts.^4)-(Tsurr.^4))+h.*(Ts-Tamb)*A

    I want to graph that function, but I have a hard time to define “Ts” as a function, but “h” is defined as a variable as I used {syms h} as a command.

    When I try to ezplot the function I get:
    rror in ==> ezplot>ezparam at 372
    X = ezplotfeval(x,T);

    Error in ==> ezplot at 163
    hp = ezparam(cax,f{1},f{2},vars,labels,args{2:end});

    Error in ==> sym.ezplot at 60
    h = ezplot(f.s,varargin{:});

    I don’t understand the language and I need help how to plot this function implicitly.

    Please can you help me?
    -Ramon

  2. Scott Hirsch replied on :

    Ramon -

    This isn’t the best forum to get help on a question like this. I’d like to suggest that you provide as much detail as you can, and either contact technical support (http://www.mathworks.com/support/), or post on the MATLAB newsgroup (http://www.mathworks.com/matlabcentral/newsreader/).

    - scott

Leave a Reply


Ken & Mike work on the MATLAB Desktop team.
  • Peter Brady: Hi Ken, Thanks for the heads up on this one but I hope there is a resolution soon. The editor is now...
  • Ken: Hi Ian, Can you be more specific about where you see performance differences? We are aware of some bottlenecks...
  • Ian: More importantly, what are you going to do about the abysmal performance of Matlab on Leopard. Many of my...
  • din: hello…may i know about matlab command(absolute command)….i aready has the prog…but they use...
  • Ken: Hi Rich, We have a bug report on the first issue you mention. As for the Command Window time-stamp format,...
  • Rich Messeder: I have a few comments that I’m trying to find the right place for. One is that when I press the...
  • Steve Eddins: Stephen—You can extend your R2008b Prerelease license by choosing the Help -> Licensing ->...
  • Mike: Stephen, We cannot give an exact date as to when the next version of MATLAB will be released.
  • Stephen Colona: Do you think the new release will come out before the PreRelease expires? Thanks.
  • Mike: Nasir, Thank you for your feedback, it helps us refine the desktop and ultimately make it easier to use....

These postings are the author's and don't necessarily represent the opinions of The MathWorks.

Related Topics