
Tables in MATLAB with uitable
I’d like to welcome guest blogger Denis Hanson from the GUI Building team. Denis will occasionally be blogging here on the Inside the MATLAB Desktop blog.
In R2008a, we added the uitable control, as well as support for this new control in Guide. The uitable component enables the display of data in a two dimensional table. You can use the Property Inspector or the new Table Property Editor to get and set uitable object property values (to open the Property Inspector type inspect at the command prompt; to open the Table Property Editor, right-click your uitable in Guide and select Table Property Editor…).
The Table Property Editor makes it easy to define the layout of a table inside Guide. The Property Inspector could be used to achieve the same results, though it’s not targeted to uitable. Lets look at using the Table Property Editor to setup a uitable.
Table properties fall into four natural categories, which are presented on separate panels. Here’s a listing of each of the Table Property Editor’s panels, and what you can do on each:
- Columns – set column names, format, size, and editability
- Rows – set row names
- Data – select data to display in the table
- Colors – set colors and control row striping
Notice also that at the top of each panel is a help section. The text in the panel will change to reflect the option that is currently selected on the property panel.
Let’s look at each of the panels in detail.
Columns Panel

The Column Headers section of this panel lets you control how and if column headers are displayed. The Column Definitions section of this panel lets you tweak properties for each column and also allows the insertion, removal and rearranging of columns.
The Format column in the Column Definitions table specifies how the data should be formated for viewing. Here are each of the options and what they do:
- Let MATLAB Choose – MATLAB chooses a format that most closely matches the underlying column data. For example, if the data in the column is doubles, the Numeric display option will be used.
- Choice List – allows you to enter a series of series of values that will be displayed in a popupmenu. This option is especially useful if the column is editable and you want to restrict the values that they user can enter.

- Format – lets you choose from a pre-defined list of formats for displaying numeric data. The options are the same as those found in the format function.


Rows Panel

The Rows panel lets you define how row headers are displayed. Row headers are shown in an additional column at the left edge of the table. They do not contain table data values. If shown, they typically display the row number, but you can enter a custom name for each row.
Data Panel
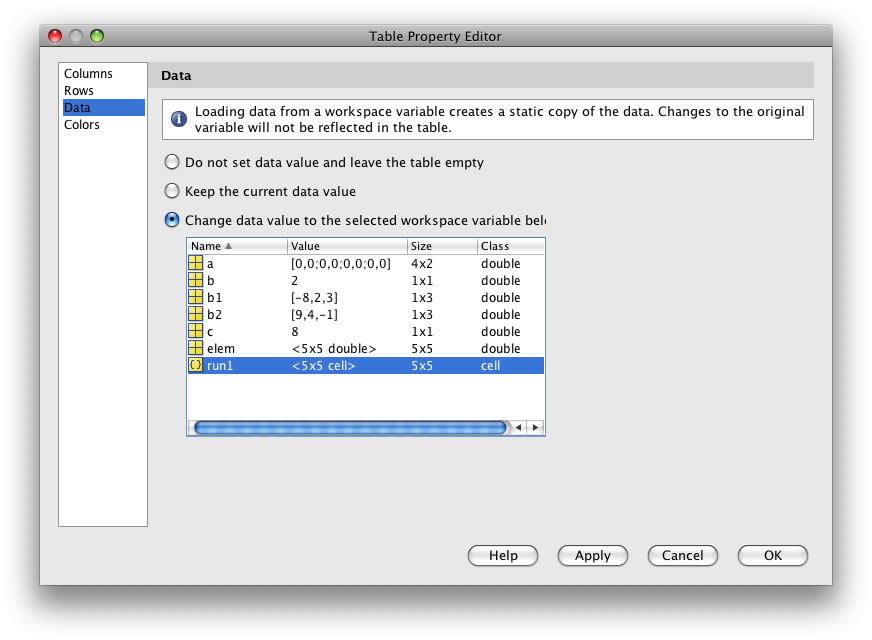
The Data panel lets you populate the table with data from workspace variables. A table row will be created for each row in your data set and a table column will be created for each column in your data set. Once you have saved the data into the table, the table contains a copy of the data. The table data is not linked to the workspace variable so further modifications to the workspace variable will not be reflected in the table.
The values you set here are used to populate the table when your figure is displayed. This is useful if you have canned data that does not change. If your data is not fixed, you should select the Do not set data value and leave the table empty option. You will then need to load table data programmatically.
Colors Panel

The Colors panel lets you define the background, foreground, and row-striping colors used to paint the cells in the table. When row-striping is on the table paints odd and even rows using different background colors. The striping effect makes it easier for a user to scan the data in a table row, especially if there are many rows of data.
This was a world-wind tour of the new uitable control – in a future post, we’ll show you how to use the new control in a real application.
Let us know what you think about uitable!
-by Denis Hanson, The MathWorks
- Category:
- MATLAB GUI


Comments
To leave a comment, please click here to sign in to your MathWorks Account or create a new one.